
Vision - Advanced Session Indicator
インジケーター
6 購入済
バージョン 1.0、Jul 2025
Windows、Mac
5.0
レビュー: 2
説明
高度なセッションインジケーター
説明:
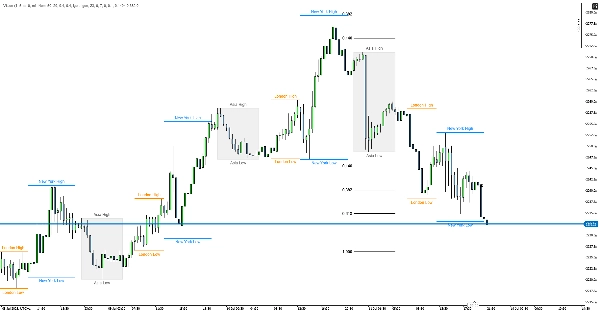
主要な取引セッションの価格帯を表示し、各セッションのボリュームプロファイル分析を追加するcTrader用のプロフェッショナルなセッションインジケーターです。
主な特徴:
📊 セッション価格ボックスとライン
- 4つの主要な取引セッション: アジア、フランクフルト、ロンドン、ニューヨーク
- 完全にカスタマイズ可能なタイミング: 各セッションは個別に設定可能
- 色分けされた価格範囲のボックスとライン: 各セッションの高値/安値を視覚的に表示
- 自動タイムゾーン処理
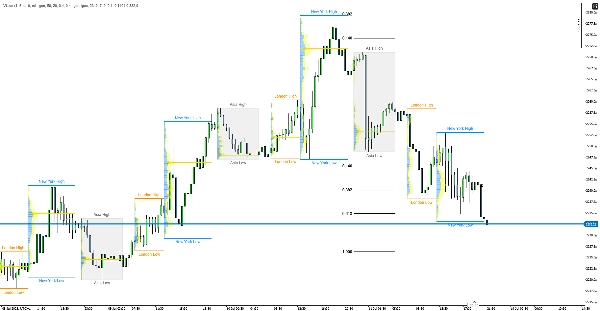
📈 セッションボリュームプロファイル
- ボリューム分布表示: 各セッションごとの別々のボリュームプロファイル
- 買い/売りボリューム: 別々の色(青/黄)
- POC(ポイント・オブ・コントロール): 最も高いボリュームの価格レベルをマーク
- カスタマイズ可能な解像度: 10〜500レベルのボリュームヒストグラム
設定
セッション時間
- アジア: 23:00-07:00(グレー)
- フランクフルト: 07:00-08:00(ダークグリーン)
- ロンドン: 09:00-14:00(オレンジ)
- ニューヨーク: 14:00-22:00(ブルー)
カスタマイズ可能なオプション
- ボックスとラインの透明度と色
- アジアセッションの延長バリエーション
- ボリュームヒストグラムの幅と透明度
- 表示する日数
- POCラインの表示
- セッションボックスとボリュームプロファイルの別々のタイムフレーム
使用方法
トレーディングアプリケーション:
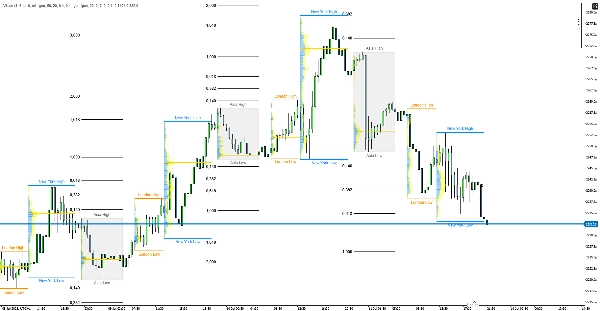
- セッションの高値/安値レベルをS/Rポイントとして使用
- 重要なレベルを示すボリュームクラスター
- 磁石のようなレベルとしてのPOCライン
- 重要性が強調されたセッションの重なり
利点: 価格アクションとボリューム分析の組み合わせ、リアルタイム更新、完全なカスタマイズ性、プロフェッショナルな外観。
概要
AIによる概要
Vision - Advanced Session Indicator is a professional tool designed for the cTrader platform to visualize and analyze major trading sessions: Asia, Frankfurt, London, and New York. It displays session price ranges using color-coded boxes and lines, highlighting high and low values for each session. The indicator supports full customization of session times, colors, transparency, and display settings, including separate timeframes for session boxes and volume profiles.
Key features include a session volume profile that shows volume distribution with distinct buy/sell volume colors and marks the Point of Control (POC), the price level with the highest traded volume. Users can customize the volume histogram resolution from 10 to 500 levels. The indicator automatically handles time zones and adjusts for Daylight Saving Time to ensure accurate session tracking.
Vision aids traders by marking session high/low levels as support and resistance points, identifying volume clusters and liquidity zones, and highlighting session overlaps. It is particularly useful for day traders seeking detailed insights into market behavior and potential entry levels based on volume and price action across different trading sessions.
インジケーターのプロフィール
カスタマーレビュー
5.0
レビュー: 2
5 | 100 % | |
4 | 0 % | |
3 | 0 % | |
2 | 0 % | |
1 | 0 % |
カスタマーレビュー
July 27, 2025
The entry needs one more reason to make sense, but the market context still matters.
July 15, 2025
The practical angle is weak trade ideas become less attractive, and signal count matters more than one nice example.
ディスカッション
よくあるご質問
Prop
Forex
Indices
Crypto
cTrader Storeで入手可能な取引ボット、インジケーター、プラグインなどの商品は、第三者の開発者が提供するものであり、情報と技術の取得のみを目的としてご利用いただけます。cTrader Storeはブローカーではなく、投資助言や個人的な推奨を行うことも、将来のパフォーマンスを保証することもありません。


これも好きかも


価格
登録日 05/01/2025
14
販売