
Supertrend - Multi-Timeframe
インジケーター
1 購入済
バージョン 1.0、Oct 2025
Windows、Mac
4.5
レビュー: 2
説明
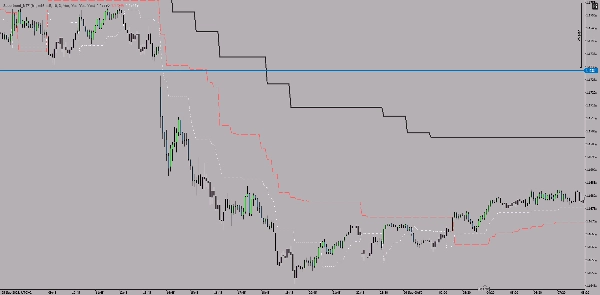
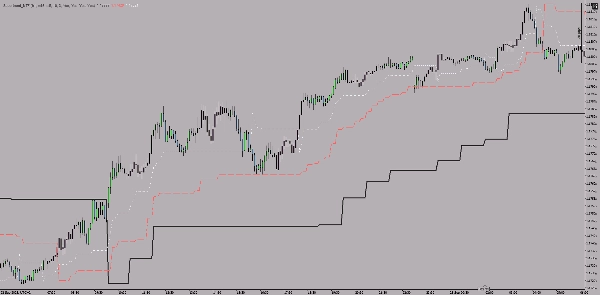
これは、cTraderプラットフォーム用のマルチタイムフレーム・スーパートレンドインジケーターで、3つの異なる時間枠のスーパートレンドラインを単一のチャート上に同時に表示します。
主な特徴
3つの並列時間枠表示:
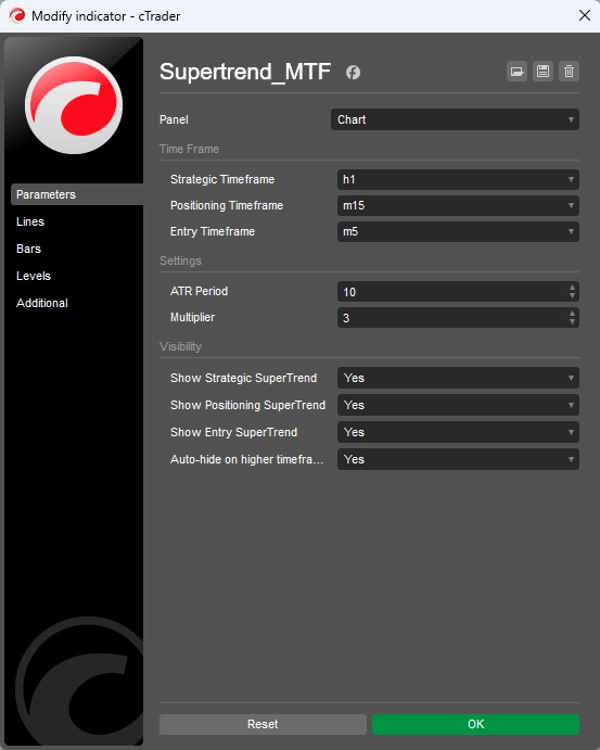
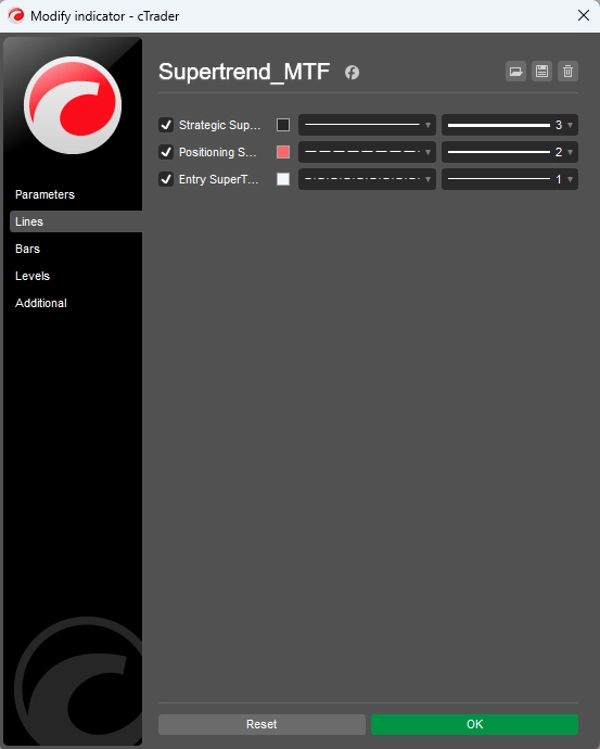
- 戦略的時間枠(デフォルト:1時間)- 太く実線
- ポジショニング時間枠(デフォルト:15分)- 中程度の太さ、破線
- エントリー時間枠(デフォルト:5分)- 細く点線
カスタマイズ可能な設定:
- ATR期間(デフォルト:10)
- 乗数(デフォルト:3.0)
- 3つの時間枠それぞれを個別に有効/無効にできます
- 上位時間枠での自動非表示(オプション)
動作原理
このインジケーターは、3つの時間枠すべてにクラシックなスーパートレンドのロジックを使用しており、以下のようになっています:
- 価格がスーパートレンドラインの上にあるとき、トレンドは上昇
- 価格がスーパートレンドラインの下にあるとき、トレンドは下降
- 異なる線の太さとスタイルで時間枠を区別しやすくしています
目的
マルチタイムフレーム分析を支援します:大きい時間枠は主な方向性(戦略)を示し、中間の時間枠はポジショニングを調整し、最小の時間枠は具体的なエントリーポイントを示します。
概要
AIによる概要
The Supertrend - Multi-Timeframe Indicator for the cTrader platform displays Supertrend lines from three distinct timeframes simultaneously on a single chart. It features a strategic timeframe (default 1 hour) shown as a thick solid line, a positioning timeframe (default 15 minutes) as a medium dashed line, and an entry timeframe (default 5 minutes) as a thin dotted line. Each timeframe can be individually enabled or disabled, with customizable settings including ATR period and multiplier. The indicator applies classic Supertrend logic: the trend is considered up when the price is above the Supertrend line and down when below. Different line styles and thicknesses visually distinguish the timeframes. This tool supports multi-timeframe analysis by providing the main directional trend from the larger timeframe, refined positioning from the middle timeframe, and specific entry points from the smallest timeframe. It is applicable across various markets including Forex, indices, commodities, stocks, and cryptocurrencies, and supports symbols such as BTCUSD, EURUSD, GBPUSD, XAUUSD, NAS100, and USDJPY.
インジケーターのプロフィール
カスタマーレビュー
4.5
レビュー: 2
5 | 50 % | |
4 | 50 % | |
3 | 0 % | |
2 | 0 % | |
1 | 0 % |
カスタマーレビュー
October 13, 2025
The part worth keeping is the setup needs a cleaner reason to exist, and a few ugly trades are useful in the sample.
October 10, 2025
ディスカッション
よくあるご質問
BTCUSD
Forex
Breakout
Indices
EURUSD
Commodities
GBPUSD
NZDUSD
Prop
Scalping
Crypto
Stocks
XAUUSD
NAS100
USDJPY
cTrader Storeで入手可能な取引ボット、インジケーター、プラグインなどの商品は、第三者の開発者が提供するものであり、情報と技術の取得のみを目的としてご利用いただけます。cTrader Storeはブローカーではなく、投資助言や個人的な推奨を行うことも、将来のパフォーマンスを保証することもありません。


![「[Stellar Strategies] MARSI Signal Plotter」ロゴ](https://cdn.ctrader.com/image/webp/7b2b8da6-8f8e-4646-8d4a-4710c516c01e_25567)


価格
登録日 05/01/2025
14
販売