
説明
マルチタイムフレームフェアバリューギャップ(FVG)インジケーター
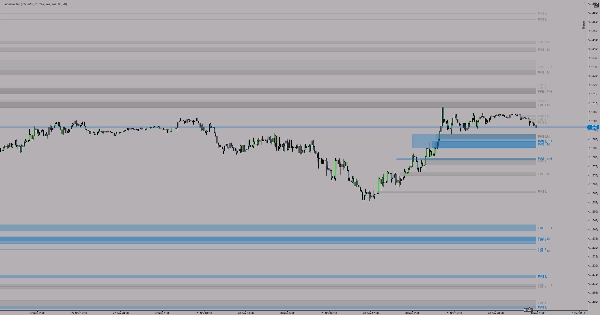
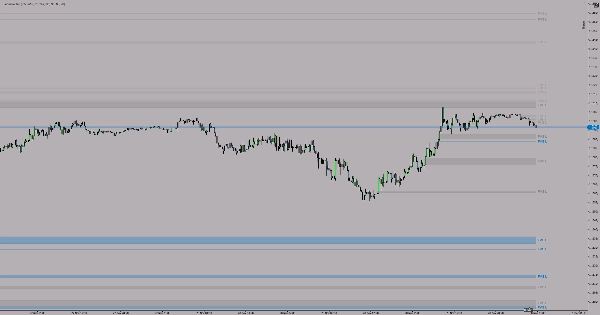
このプロフェッショナルなFVGインジケーターは、スマートマネーコンセプト(SMC)トレーディング手法の基本的なツールの一つであり、3つの異なるタイムフレームにわたるフェアバリューギャップをリアルタイムで特定・表示し、検証および緩和の追跡が可能です。
主な特徴
マルチタイムフレーム分析
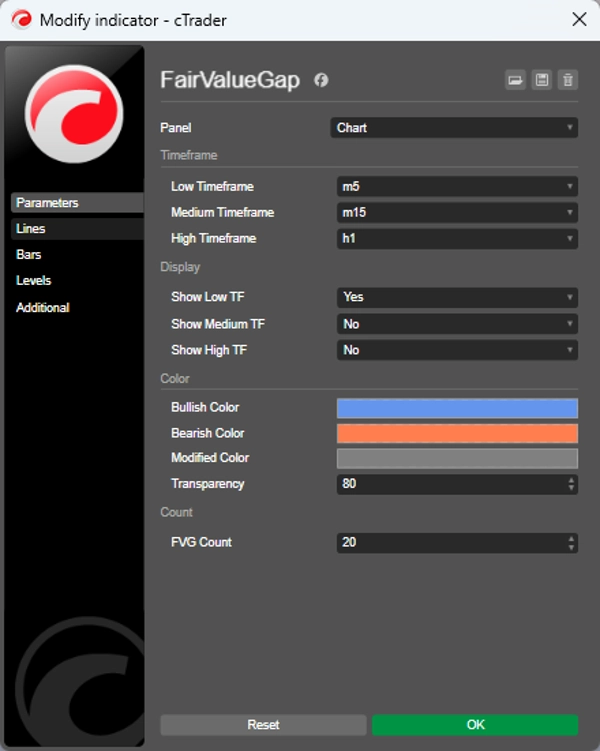
- 単一のチャートから個別に設定可能な3つのタイムフレームを同時に監視
- 各タイムフレームごとの表示のオン/オフ切り替え
- 識別しやすいように各タイムフレーム(L、M、H)の視覚的ラベリング
トレーダーのためのプロフェッショナルな利点
1. マルチレベルのコンフルエンス識別
3つのタイムフレームを同時に表示することで、異なるタイムフレームのFVGが重なるコンフルエンスゾーンを迅速に特定できます。これらのゾーンは統計的に反応の確率が高いです。
2. 緩和状況の追跡
色分け表示により、FVGが「タッチ」された時点を即座に示します。これは重要な情報です:
- 最初のタッチはしばしば強い反応を引き起こします
- 緩和されたFVGは一般的に弱いサポート/レジスタンスゾーンです
3. クリーンなチャート、集中したトレーディング
- タイムフレームごとのFVG数を制限(デフォルト:20)
- 関連性のあるアクティブなギャップのみが表示されます
SMC/LITトレーダー、機関投資家のトレーディング手法を使用する方、価格と流動性のダイナミクスを理解してトレードしたいトレーダーに最適なツールです。
概要
AIによる概要
FVGMTF is a multi-timeframe Fair Value Gap (FVG) indicator designed for use in Smart Money Concept (SMC) trading methodologies. It identifies and displays fair value gaps across three configurable timeframes simultaneously on a single chart, with options to toggle each timeframe’s visibility and clear visual labels (L, M, H) for easy differentiation.
Key functionalities include multi-level confluence identification by highlighting overlapping FVGs from different timeframes, which may indicate stronger reaction zones. The indicator tracks mitigation status with color-coded signals to show when an FVG has been touched, distinguishing between first touches that often trigger strong reactions and mitigated gaps that act as weaker support or resistance.
To maintain chart clarity, the indicator limits the number of visible FVGs per timeframe (default 20) and displays only active, relevant gaps. It supports various markets and symbols including Forex, Crypto, Indices, Commodities, and Stocks, with tags referencing popular pairs like BTCUSD, EURUSD, GBPUSD, and instruments such as NAS100 and XAUUSD.
This tool is suited for traders employing institutional trading techniques and those focused on price-liquidity dynamics within multi-timeframe analysis.
インジケーターのプロフィール
カスタマーレビュー
5.0
レビュー: 1
5 | 100 % | |
4 | 0 % | |
3 | 0 % | |
2 | 0 % | |
1 | 0 % |
ディスカッション
よくあるご質問
BTCUSD
Forex
Signal
Indices
EURUSD
Commodities
GBPUSD
NZDUSD
Prop
Fair Value Gap
SMC
Crypto
Stocks
XAUUSD
NAS100
USDJPY
cTrader Storeで入手可能な取引ボット、インジケーター、プラグインなどの商品は、第三者の開発者が提供するものであり、情報と技術の取得のみを目的としてご利用いただけます。cTrader Storeはブローカーではなく、投資助言や個人的な推奨を行うことも、将来のパフォーマンスを保証することもありません。


価格
登録日 05/01/2025
14
販売