
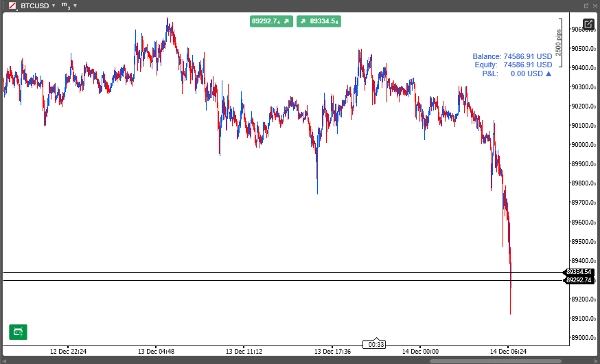
Equity and Balance
مؤشر
1 عمليات الشراء
الإصدار 2.0، Dec 2025
Windows, Mac
4.5
التقييمات: 2
الوصف
لوحة تداول الوقت الحقيقي لـ cTrader
عرض تقديمي مختصر:
حوّل مخططات cTrader الخاصة بك إلى قمرة قيادة تداول احترافية مع هذا التراكب الأنيق لمعلومات الحساب في الوقت الحقيقي. مثالي للمتداولين الذين يرغبون في رؤية فورية لحالة حسابهم دون الحاجة لتبديل النوافذ.
الميزات الرئيسية:
- ✅ عرض الرصيد، حقوق الملكية، والأرباح والخسائر في الوقت الحقيقي – دائمًا مرئي في زاوية المخطط الخاص بك
- ✅ تخصيص الموضع والألوان – اختر من بين 9 مواضع محاذاة وأنظمة ألوان مخصصة
- ✅ محسّن للأداء – فترات تحديث قابلة للضبط لتقليل استخدام وحدة المعالجة المركزية
- ✅ مقاييس الهامش والمخاطر – يشمل الهامش المستخدم، الهامش الحر، ونسب مستوى الهامش
- ✅ تصميم بصري احترافي – طباعة نظيفة مع مؤشرات الربح/الخسارة (▲/▼)
- ✅ يعمل على جميع الأطر الزمنية والأدوات – تراكب غير متداخل يبقى في الخلفية
مثالي لـ:
- المتداولين الذين يراقبون عدة مخططات في نفس الوقت
- المتداولين الخوارزميين الذين يحتاجون إلى فحوصات سريعة لحالة الحساب
- المبتدئين الذين يتعلمون تتبع أداء الحساب
- المحترفين الذين يرغبون في مساحة عمل تداول أنظف
cBot آخر متاح قريبًا:
- لوحة التداول النهائية
- لوحة التحكم في الأوامر
الملخص
ملخص الذكاء الاصطناعي
Equity and Balance is a real-time trading indicator designed for the cTrader platform that overlays key account metrics directly onto trading charts. It displays live balance, equity, profit and loss (P&L), margin used, free margin, and margin level percentages, providing continuous visibility without switching windows. The display is customizable with nine alignment positions and various color schemes to fit user preferences. It features a professional visual design with clear typography and profit/loss indicators (▲/▼). The indicator is optimized for performance with configurable update intervals to minimize CPU usage. It works seamlessly across all timeframes and instruments, maintaining a non-intrusive presence in the chart background. This tool is suitable for traders monitoring multiple charts, algorithmic traders requiring quick account status checks, beginners tracking account performance, and professionals seeking a cleaner workspace. Supported markets include Forex, indices, commodities, cryptocurrencies, and stocks.
ملف تعريف المؤشر
تقييمات العملاء
4.5
التقييمات: 2
5 | 50 % | |
4 | 50 % | |
3 | 0 % | |
2 | 0 % | |
1 | 0 % |
تقييمات العملاء
December 25, 2025
The signal still needs a chart check, no surprise there. Bad settings can ruin the idea.
December 24, 2025
The setup improves when the noisy parts of the chart show up earlier, and 30 days gives the idea room.
مناقشة
الأسئلة الشائعة
Prop
Forex
Indices
Commodities
Crypto
Stocks
يتم توفير المنتجات المتاحة من خلال cTrader Store، بما في ذلك روبوتات التداول والمؤشرات والإضافات، من قبل مطوري الطرف الثالث وإتاحتها لأغراض الوصول المعلوماتي والفني فقط. cTrader Store ليس وسيطًا ولا يقدم نصائح استثمارية أو توصيات شخصية أو أي ضمان للأداء المستقبلي.
المزيد من هذا المؤلف


![شعار "[Hamster-Coder] Pivot Points MTF"](https://cdn.ctrader.com/image/webp/4c143e5a-309c-40e3-a578-f04d1e133ffa_31159)


السعر
منذ 19/08/2025
4
المبيعات
315
التثبيتات المجانية