
MultiTimeFrameTrend
مؤشر
2 عمليات الشراء
الإصدار 1.0، Jul 2025
Windows, Mac
4.0
التقييمات: 3
الوصف
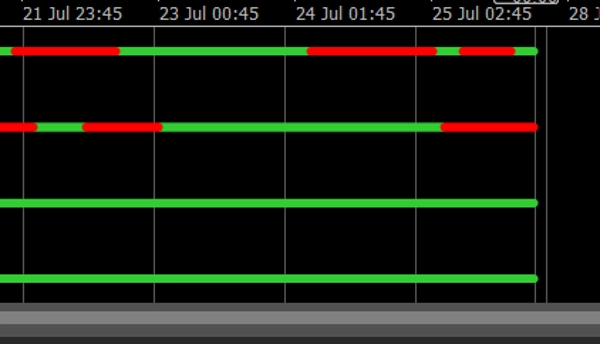
نقاط الاتجاه متعدد الأطر الزمنية هو مؤشر اتجاه قوي وبسيط تم تصميمه لـ cTrader. يسمح للمتداولين بتتبع اتجاه الاتجاه بصريًا عبر ما يصل إلى 4 أطر زمنية قابلة للاختيار باستخدام خطوط نقاط ملونة بسيطة لكنها فعالة.
✅ الأخضر = اتجاه صاعد
✅ الأحمر = اتجاه هابط
✅ تصميم نظيف في نافذة فرعية واحدة
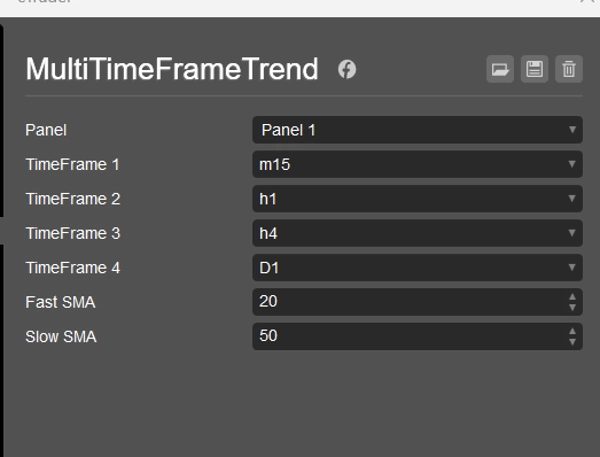
✅ إعدادات SMA سريعة/بطيئة قابلة للتخصيص
✅ يعمل على أي رمز وأي إطار زمني
سواء كنت متداول سكالبينج، متداول داخل اليوم، أو متداول تأرجحي، يمنحك هذا المؤشر نظرة سريعة على توافق الأطر الزمنية المتعددة — مثالي لاتخاذ قرارات دخول واثقة أو لتصفية الإعدادات السيئة.
💼 يتضمن:
- منطق الاتجاه بناءً على تقاطع SMA
- وضع النقاط على 4 مستويات (معدل للقراءة)
- تسميات الأطر الزمنية في نهاية كل خط اتجاه
- متوافق تمامًا مع جميع إصدارات cTrader
🎁 رفيق مثالي لبناء الاستراتيجيات أو التداول اليدوي.
الملخص
ملف تعريف المؤشر
تقييمات العملاء
4.0
التقييمات: 3
5 | 0 % | |
4 | 100 % | |
3 | 0 % | |
2 | 0 % | |
1 | 0 % |
تقييمات العملاء
August 10, 2025
July 30, 2025
The main upside is it brings another read without hijacking the plan, and one green trade proves nothing.
July 29, 2025
The reason it feels usable is the process slows down in a good way, and a 1R exit plan makes review easier.
مناقشة
الأسئلة الشائعة
يتم توفير المنتجات المتاحة من خلال cTrader Store، بما في ذلك روبوتات التداول والمؤشرات والإضافات، من قبل مطوري الطرف الثالث وإتاحتها لأغراض الوصول المعلوماتي والفني فقط. cTrader Store ليس وسيطًا ولا يقدم نصائح استثمارية أو توصيات شخصية أو أي ضمان للأداء المستقبلي.
المزيد من هذا المؤلف


السعر
منذ 21/01/2025
3
المبيعات