
الوصف
وصف المؤشر:
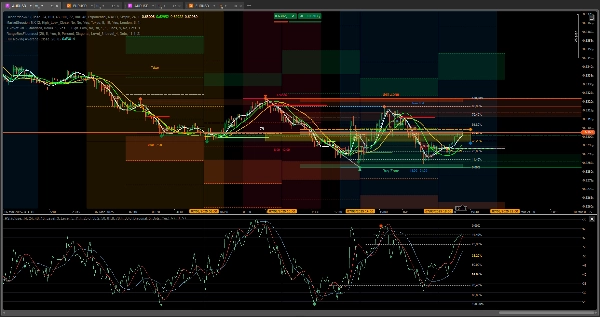
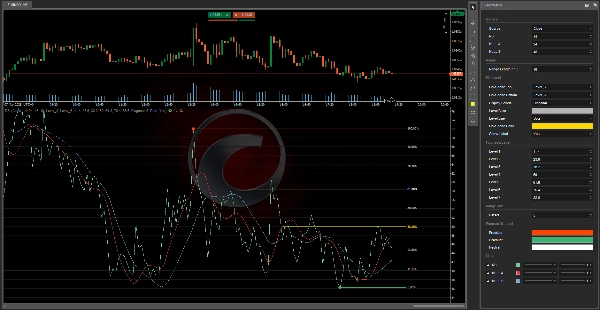
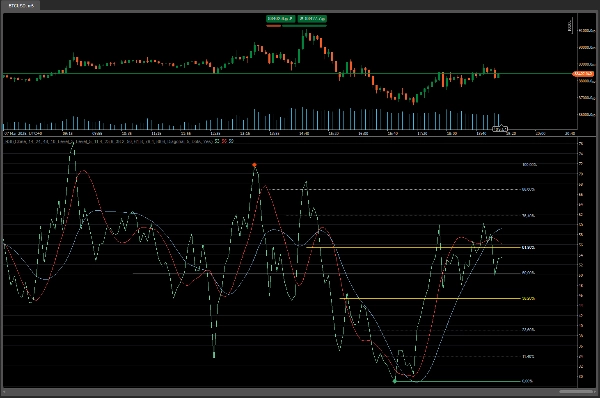
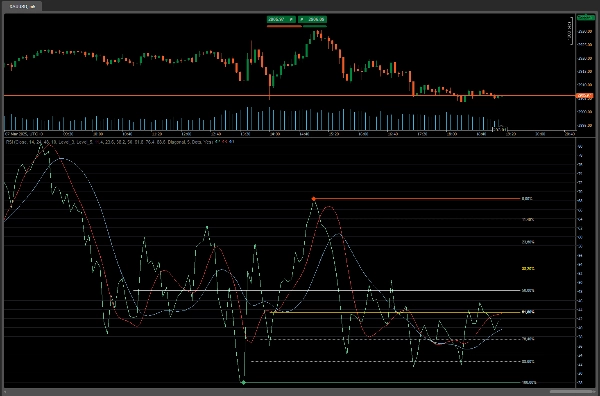
🎯 مؤشر RSI مع مستويات فيبوناتشي ومتوسطات هول المتحركة 🚀
هل تريد الارتقاء بتحليلك الفني إلى المستوى التالي؟ هذا المؤشر لك! يجمع بين أفضل ثلاثة أدوات قوية: RSI (مؤشر القوة النسبية)، مستويات فيبوناتشي، ومتوسطات هول المتحركة لتزويدك برؤية شاملة ودقيقة للسوق.
الميزات الرئيسية:
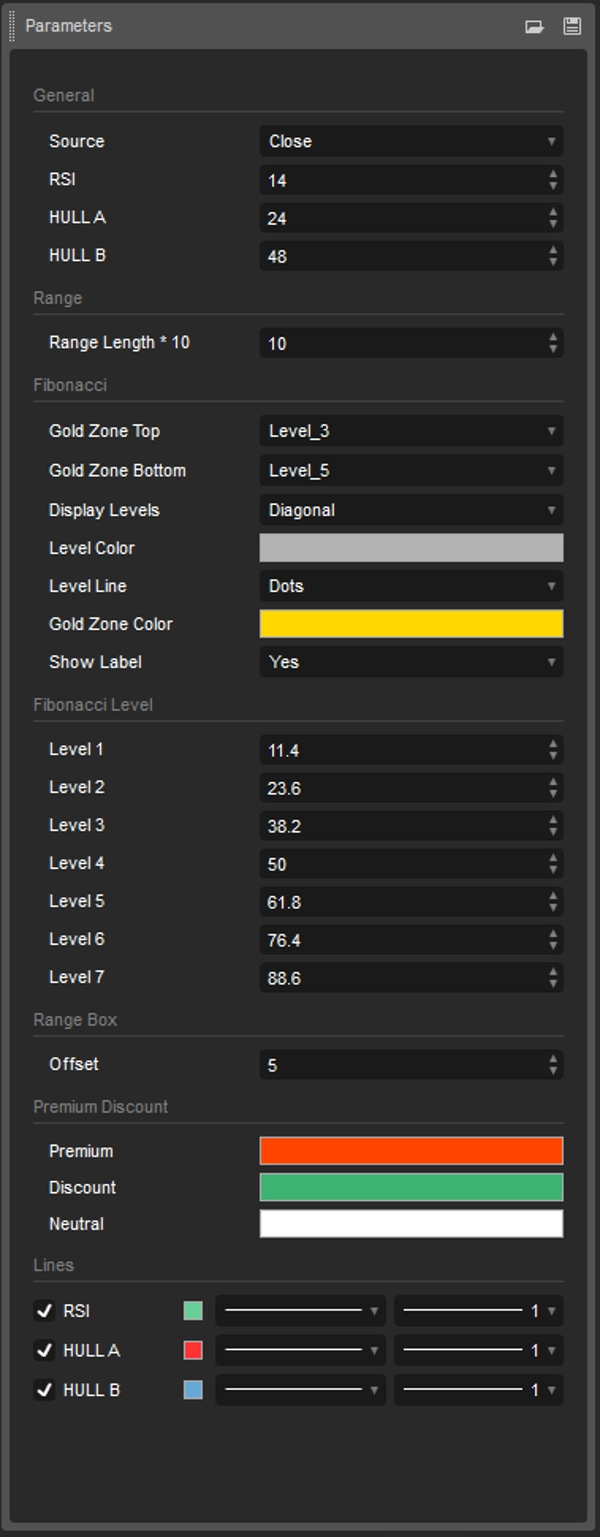
- RSI مع مستويات فيبوناتشي:
-
- يحدد مناطق الدعم والمقاومة الرئيسية بناءً على مستويات فيبوناتشي.
- يساعد في اكتشاف احتمالات الانعكاسات والاستمراريات بدقة أكبر.
- متوسطات هول المتحركة:
-
- يشمل متوسطين متحركين من نوع هول (هول A و هول B) لتصفية ضوضاء السوق والتقاط الاتجاهات بكفاءة أكبر.
- يوفر إشارات واضحة للدخول والخروج بناءً على التقاطعات وتغيرات الاتجاه.
- مناطق تغير الاتجاه:
-
- يسلط الضوء على المناطق الحرجة حيث من المحتمل حدوث تغيرات في الاتجاه، مما يساعدك على توقع تحركات كبيرة.
- تخصيص كامل:
-
- اضبط مستويات فيبوناتشي والألوان وأنماط الخطوط لتناسب تفضيلاتك.
- قم بتكوين متوسطات هول المتحركة لتتناسب مع استراتيجيتك التداولية.
- تصوير واضح:
-
- أيقونات وخطوط اتجاه محددة جيدًا لتفسير سريع وسهل.
- تسميات اختيارية لعرض مستويات فيبوناتشي بالنسبة المئوية.
فوائد للمتداولين:
- دقة أكبر: يجمع بين RSI مع مستويات فيبوناتشي ومتوسطات هول المتحركة لإشارات أكثر موثوقية.
- توفير الوقت: لا حاجة لتراكب مؤشرات متعددة؛ كل شيء مدمج في أداة واحدة.
- التنوع: يعمل على أي إطار زمني وسوق (الفوركس، الأسهم، العملات الرقمية، إلخ).
- سهولة الاستخدام: مصمم للمتداولين من جميع المستويات، من المبتدئين إلى الخبراء.
لماذا تحميل هذا المؤشر؟
- مبتكر: مزيج فريد من الأدوات الكلاسيكية والحديثة التي لن تجدها في مؤشرات أخرى.
- فعال: يساعدك على تحديد فرص التداول بوضوح وثقة أكبر.
كيفية استخدامه:
- تحديد الاتجاه: استخدم متوسطات هول المتحركة لتحديد اتجاه السوق.
- البحث عن إشارات RSI: تحقق مما إذا كان RSI في حالة تشبع شراء أو تشبع بيع بالقرب من مستويات فيبوناتشي.
- التأكيد باستخدام فيبوناتشي: استخدم مستويات فيبوناتشي لتحديد مناطق الدعم والمقاومة الرئيسية.
- اتخاذ قرارات مستنيرة: ادخل أو اخرج من الصفقات بثقة أكبر بناءً على إشارات واضحة ودقيقة.
قم بالتحميل الآن وحسّن تداولك!
لا تضيع المزيد من الوقت في تحليل الرسوم البيانية يدويًا. مع هذا المؤشر، سيكون لديك كل ما تحتاجه في مكان واحد. اجعل تداولك أكثر كفاءة وربحية!
ومع أداتين، يمكنك التوقف عن القلق بشأن ما سيفعله السوق، بنظرة بسيطة ستعرف – اشترِ أو بيع وانتقل إلى مهمة أخرى.
RangeBoxFibonacci: https://ctrader.com/products/526?u=VIZAINT
OrderPrice-V3: https://ctrader.com/products/397?u=VIZAINT
وللاختيار
NTMPICLL https://ctrader.com/products/327?u=VIZAINT
MacdVolume https://ctrader.com/products/267?u=VIZAINT
MarketSession-MX: https://ctrader.com/products/525?u=VIZAINT
الملخص
تقييمات العملاء
5 | 100 % | |
4 | 0 % | |
3 | 0 % | |
2 | 0 % | |
1 | 0 % |


