Beschreibung
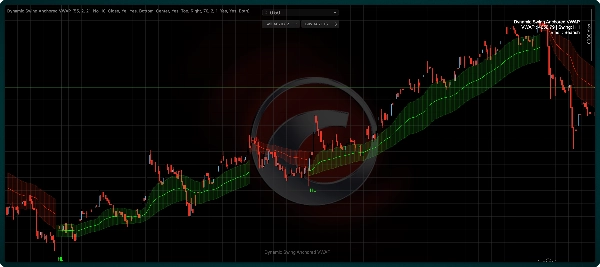
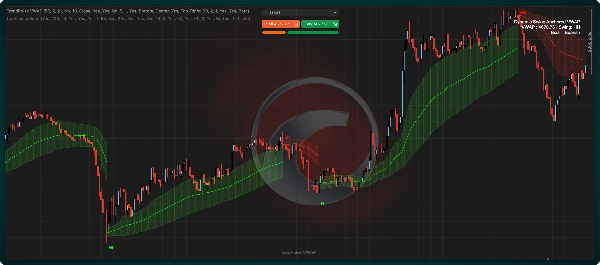
TrendPulse VWAP ist ein strukturorientierter VWAP-Indikator, der sich automatisch an bestätigte Swing-Pivots anpasst, anstatt eine feste Sitzungsrücksetzung zu verwenden.
Er ist für Trader konzipiert, die eine adaptivere Sicht auf Preisstruktur, Richtungsfluss und Wertzonen wünschen. Der Indikator verfolgt bestätigte Swing-Hochs und -Tiefs, bestimmt die aktive strukturelle Tendenz und baut den VWAP aus bedeutenden Pivots neu auf, sodass die Linie mit dem Marktkontext übereinstimmt.
Im Gegensatz zu einem traditionellen Sitzungs-VWAP folgt dieses Tool der Marktstruktur. Es kann bullische und bärische Verschiebungen hervorheben, optionale Abweichungsbänder anzeigen, Pivots beschriften und ein kompaktes Chart-Dashboard mit dem aktuellen Trend und dem letzten Swing-Zustand zeigen.
➤ Hauptmerkmale
- Dynamischer, an Swing-Pivots verankerter VWAP mit konfigurierbarer Anker-Policy
- Konfigurierbare Pivot-Bestätigung für Swing-Validierung nur auf der rechten Seite
- Swing-Zustandsbeschriftung für visuellen Strukturkontext
- Optionale strengere Steuerung der Anker-Policy
- Ankerqualitätsfilter für kontrolliertes erneutes Verankern
- Adaptive Glättung mit optionalen volatilitätsbewussten Bändern
- Tick-Volumen-Verarbeitung mit Spike-Begrenzung
- Rendering-Steuerungen für lange Historien
- Kompaktes Dashboard mit flexibler Platzierung
- Automatisierungsfähige Ausgaben für cBot-Workflows
➤ Funktionsweise
- Bestätigt Swing-Hochs und -Tiefs anhand der konfigurierten Lookback- und Bestätigungsbalken.
- Leitet die aktive Strukturrichtung aus den zuletzt bestätigten Pivots ab.
- Klassifiziert den neuesten Pivot-Kontext zur visuellen Referenz.
- Verankert den VWAP neu, wenn die Anker-Akzeptanzregeln erfüllt sind.
- Aktualisiert den verankerten VWAP Zustand Balken für Balken, wenn kein neuer Anker akzeptiert wird.
- Erstellt optionale Bänder aus konfigurierten Volatilitätsmaßen.
➤ Am besten geeignet für
- Intraday- und Swing-Trader, die VWAP-Kontext mit Strukturwahrnehmung wünschen
- Trader, die adaptiven Trendkontext mit kontrolliertem erneuten Verankerungsverhalten wünschen
➤ Anwendung
- Lesen Sie die Struktur vom Dashboard-Trendindikator und den Swing-Beschriftungen ab.
- Passen Sie die Sensitivität mit Bestätigungsbalken und Ankerqualitätskontrollen an.
- Verwenden Sie VWAP und optionale Bänder für den Lagekontext relativ zur aktuellen Struktur.
➤ Enthaltene Steuerungen
- Swing-Sensitivitäts- und Bestätigungseinstellungen
- Adaptive Glättungs- und Volatilitätsbias-Steuerungen
- Ankerqualitäts- und Rücksetzrichtlinien-Steuerungen
- Bandmodell- und Bandabstands-Steuerungen
- Visuelle Steuerungen für Beschriftungen, Trendhintergrund und Render-Horizont
- Farb-Anpassung für bessere Lesbarkeit des Charts
Zusammenfassung
Key features include configurable pivot confirmation and anchor quality filters, swing-state labeling for visual structure context, optional volatility-based deviation bands, adaptive smoothing, tick-volume handling with spike capping, and a compact dashboard displaying current trend and last swing state. The indicator supports automation-ready outputs for integration with cBot workflows.
TrendPulse VWAP is suited for intraday and swing traders seeking a dynamic VWAP that adapts to market structure changes with controlled re-anchoring behavior. Users can adjust sensitivity and anchor policies to tailor the indicator’s responsiveness and use the VWAP line and bands to assess price location relative to the evolving trend and confirmed pivots.
Kundenbewertungen
5 | 100 % | |
4 | 0 % | |
3 | 0 % | |
2 | 0 % | |
1 | 0 % |