
Zero Lag LSMA
Gösterge
6 satın almalar
Sürüm 1.0, Aug 2025
Windows, Mac
4.6
Değerlendirmeler: 3
Açıklama
Sıfır Gecikmeli LSMA (En Küçük Kareler Hareketli Ortalama), trend analizinde gelişmiş tepki hızı ve hassasiyet arayan tüccarlar için tasarlanmış ileri teknoloji bir teknik göstergedir. Fiyat hareketinin gerisinde kalan geleneksel hareketli ortalamaların aksine, çift doğrusal regresyon işlemi uygulayarak gecikmeyi en aza indirir ve gerçek zamanlı olarak trend yönünü ve potansiyel dönüşleri belirlemek için idealdir. Bu gösterge forex, hisse senetleri, emtialar ve diğer piyasalar için mükemmeldir.
Ana Özellikler
- Sıfır Gecikmeli Performans: Geleneksel hareketli ortalamalarda bulunan gecikmeyi azaltır, trend değişiklikleri için daha hızlı sinyaller sağlar.
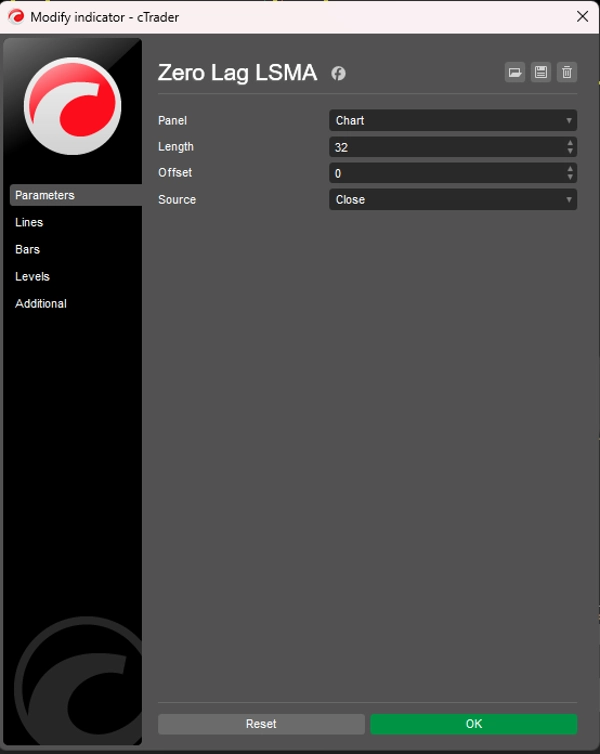
- Özelleştirilebilir Parametreler: Ticaret stratejinize uyacak şekilde uzunluk, ofset ve fiyat kaynağını (Açılış, Yüksek, Düşük, Kapanış) ayarlayın.
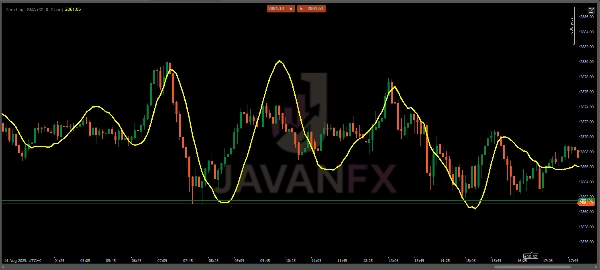
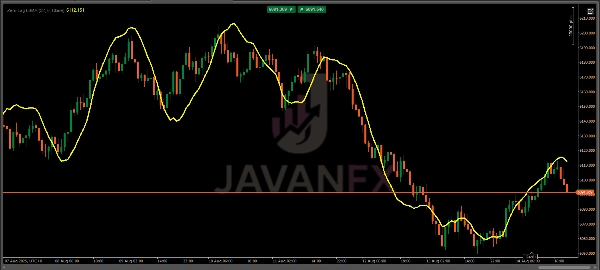
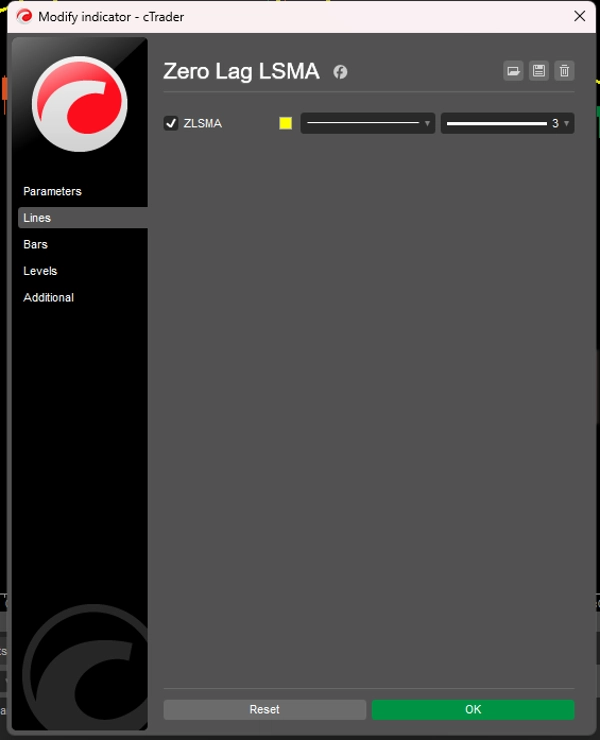
- Görsel Olarak Sezgisel: Fiyat grafiği üzerinde kolay yorumlama için sarı, düzgün bir çizgi olarak görüntülenir.
- Çok Yönlü Uygulama: Farklı zaman dilimlerinde scalping, günlük işlem, swing trading ve uzun vadeli stratejiler için uygundur.
Nasıl Kullanılır
- Trend Tanımlama:
-
- ZLSMA çizgisi yukarı doğru eğimliyse, bu yükseliş trendini gösterir.
- Aşağı doğru eğim ise düşüş trendini işaret eder.
- Düz veya dalgalı hareket konsolidasyon veya trend eksikliği gösterebilir.
- Giriş/Çıkış Sinyalleri:
-
- Alış Sinyali: Fiyat, özellikle onaylanmış bir yükseliş trendinden sonra ZLSMA çizgisinin üzerine çıktığında uzun pozisyona girin.
- Satış Sinyali: Fiyat, düşüş trendinde ZLSMA çizgisinin altına indiğinde kısa pozisyona girin.
- Çıkış Sinyali: Fiyat tekrar ZLSMA çizgisini geçtiğinde veya çizgi yataylaştığında, potansiyel bir trend dönüşünü gösterdiğinde çıkışı düşünün.
- Onay:
-
- Sinyalleri doğrulamak ve yanlış kırılmaları önlemek için ZLSMA'yı diğer göstergelerle (ör. RSI, MACD) veya destek/direnç seviyeleriyle birleştirin.
- Daha güçlü trend sinyalleri için daha yüksek zaman dilimlerinde (H1, H4, D1) veya scalping için daha düşük zaman dilimlerinde (M5, M15) kullanın.
Ticaret Stratejileri
- Trend Takibi: Güçlü trendlerde, trend yönünde ZLSMA çizgisine geri çekilmelerde pozisyona girerek trendi takip edin.
- Dönüş Ticareti: Fiyatın ZLSMA çizgisinden sapmasını ve mum formasyonlarını (ör. iğne çubukları, yutan mumlar) dönüş kurulumları için arayın.
- Kırılma Ticareti: Yüksek volatilite dönemlerinde ZLSMA'nın üzerinde/altında fiyat kırılmalarını izleyerek potansiyel giriş noktalarını takip edin.
Optimal Kullanım İçin İpuçları
- Piyasa Koşullarına Göre Uzunluğu Ayarlayın: Daha hızlı piyasalar veya scalping için daha kısa bir uzunluk (ör. 10-20), daha yüksek zaman dilimlerinde daha düzgün trendler için daha uzun bir uzunluk (ör. 50-100) kullanın.
- Demo Hesapta Test Edin: Canlı işlem yapmadan önce, tercih ettiğiniz piyasalarda ZLSMA'nın davranışını anlamak için demo hesapta geriye dönük test yapın.
- Dalgalı Piyasalarda Aşırı İşlemden Kaçının: ZLSMA en iyi trend piyasalarında performans gösterir; yan piyasalarda yanlış sinyalleri önlemek için ek filtreler (ör. ADX) kullanın.
Özet
YZ özeti
The Zero Lag LSMA (Least Squares Moving Average) is a technical indicator designed to enhance trend analysis by minimizing the lag typical of traditional moving averages. It uses a double linear regression process to provide faster and more responsive signals, making it suitable for real-time identification of trend direction and potential reversals. The indicator is applicable across various markets including forex, stocks, and commodities.
Key features include customizable parameters such as length, offset, and price source (Open, High, Low, Close), allowing adaptation to different trading strategies. It displays as a smooth yellow line overlaid on the price chart for clear visual interpretation. The indicator supports multiple trading styles and timeframes, from scalping to long-term strategies.
Traders use the Zero Lag LSMA to identify trends by observing the slope of the line: upward for bullish trends, downward for bearish, and flat for consolidation. Entry and exit signals are generated when price crosses the LSMA line, with additional confirmation recommended through other indicators or support/resistance levels. The indicator supports trend following, reversal, and breakout trading strategies, with adjustable settings to optimize performance under varying market conditions.
Gösterge profili
Müşteri değerlendirmeleri
4.6
Değerlendirmeler: 3
5 | 67 % | |
4 | 33 % | |
3 | 0 % | |
2 | 0 % | |
1 | 0 % |
Müşteri değerlendirmeleri
October 10, 2025
Zero lag, full clarity ⚡ LSMA tracks price action like a scalpel — sharp, fast, and smooth. Great trend filter for any timeframe!
August 27, 2025
The only reason it stays interesting is the setup needs less second guessing. A normal demo run is enough to see the weak spots.
August 16, 2025
Not bad if the rules are already clear. Spread and slippage need a line in the notes.
Tartışma
SSS
cTrader Store üzerinden erişilebilen işlem botları, göstergeler ve eklentiler gibi ürünler, üçüncü taraf sağlayıcılar tarafından sağlanır ve yalnızca bilgilendirme ve teknik erişim amaçlarıyla sunulur. cTrader Store bir broker değildir ve yatırım tavsiyesi, kişisel öneriler vermez veya gelecekteki performansı garanti etmez.


Fiyat
Başlangıç 14/07/2025
60
Satışlar