説明
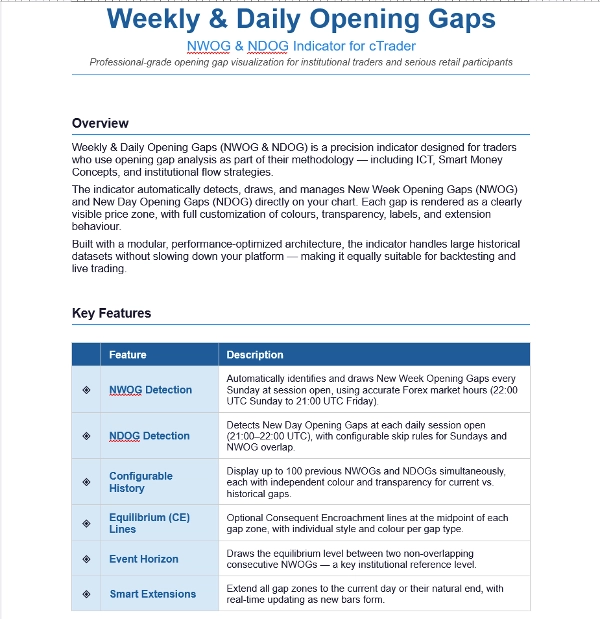
週間および日次のオープニングギャップ — NWOG & NDOG インジケーター
機関投資家および真剣な個人投資家向けのプロフェッショナルグレードのオープニングギャップ可視化
概要
週間および日次のオープニングギャップ(NWOG & NDOG)は、オープニングギャップ分析を手法の一部として使用するトレーダー向けに設計された精密なインジケーターです。ICT、スマートマネーコンセプト、機関フローストラテジーを含みます。
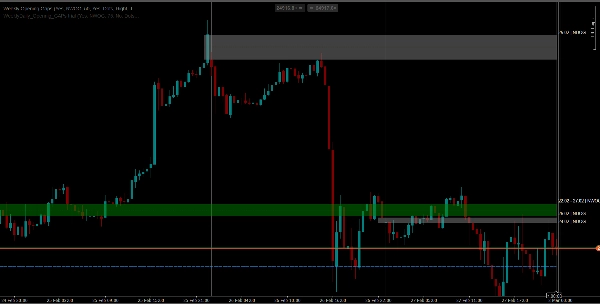
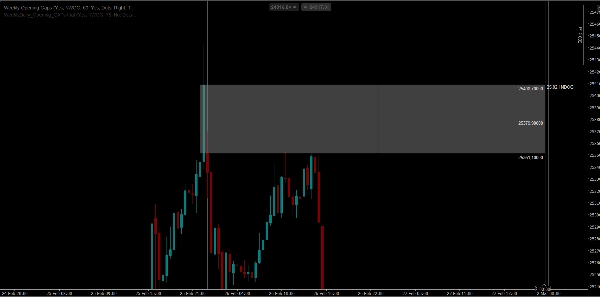
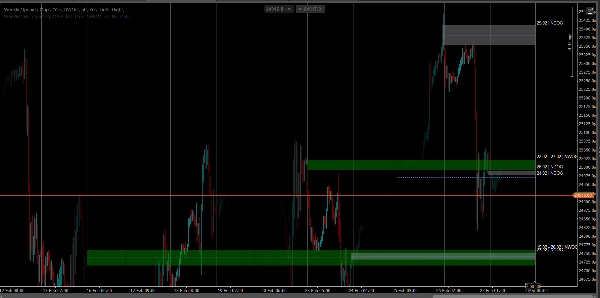
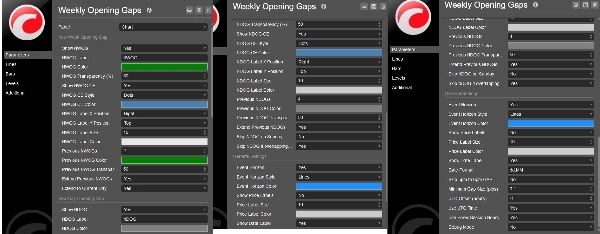
このインジケーターは、新しい週のオープニングギャップ(NWOG)および新しい日のオープニングギャップ(NDOG)を自動的に検出し、チャート上に描画・管理します。各ギャップは明確に見える価格ゾーンとして表示され、色、透明度、ラベル、拡張動作を完全にカスタマイズ可能です。
モジュール式でパフォーマンス最適化されたアーキテクチャで構築されており、大量の過去データセットを処理してもプラットフォームの動作が遅くなることはありません。バックテストおよびライブトレードの両方に適しています。
主な特徴
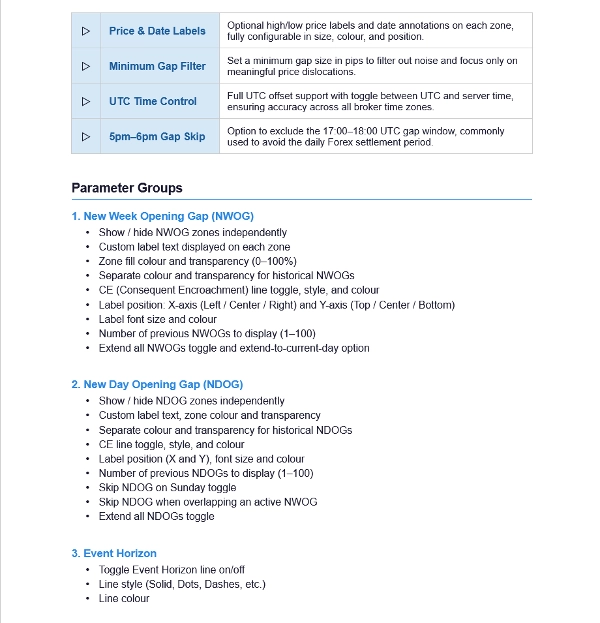
◈ NWOG 検出
◈ 日曜およびNWOG重複のスキップルールを設定可能なNDOG検出
◈ 設定可能な履歴 — 最大100の過去NWOGを表示
◈ 均衡(CE)ライン
◈ イベントホライズン — 重複しない連続する2つのNWOG間の均衡レベルを描画
◈ スマート拡張 — すべてのギャップゾーンを現在の日または自然な終了まで拡張し、新しいバーの形成に応じてリアルタイムで更新
◈ 価格および日付ラベル
◈ 最小ギャップフィルター
◈ UTC時間制御
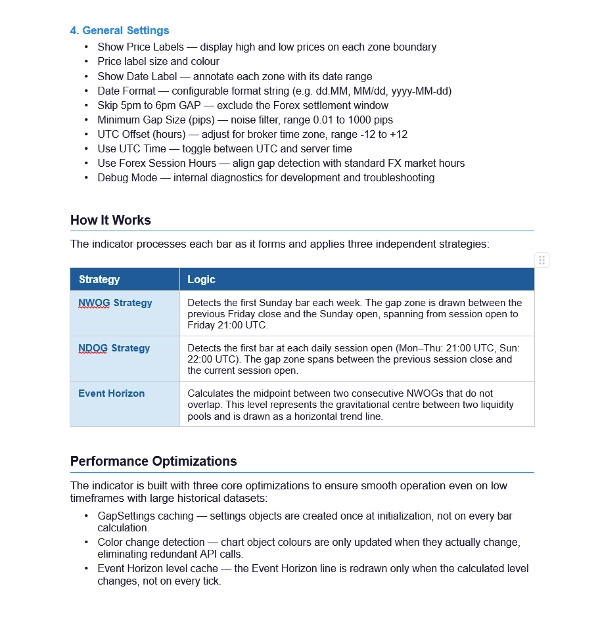
動作方法
NWOG戦略 — 毎週最初の日曜日のバーを検出します。ギャップゾーンは前週金曜日の終値と日曜日の始値の間に描画され、セッション開始から金曜日21:00 UTCまでの範囲です。
NDOG戦略 — 毎日のセッション開始時の最初のバーを検出します(月〜木:21:00 UTC、日曜:22:00 UTC)。ギャップゾーンは前セッションの終値と現在のセッションの始値の間に広がります。
イベントホライズン — 重複しない連続する2つのNWOG間の中間点を計算します。このレベルは2つの流動性プール間の重力中心を表し、水平トレンドラインとして描画されます。
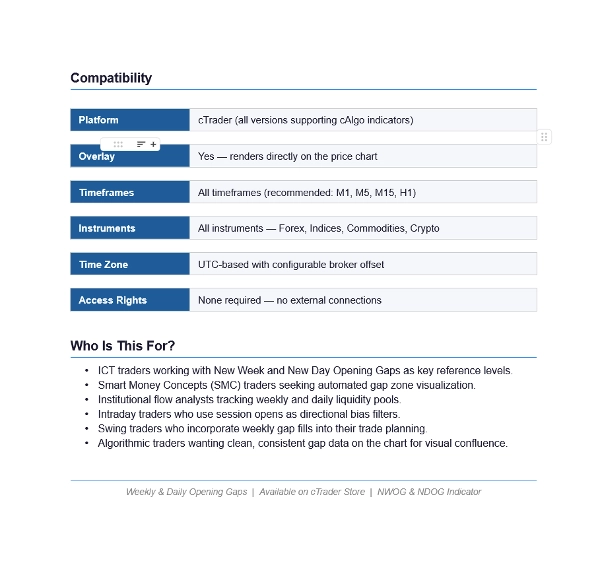
対応環境
プラットフォーム:cTrader(cAlgoインジケーターをサポートするすべてのバージョン)
オーバーレイ:あり — 価格チャート上に直接描画
タイムフレーム:すべてのタイムフレーム(推奨:M1、M5、M15、H1)
対象銘柄:すべて — 外国為替、指数、商品、C
対象ユーザー
新しい週および新しい日のオープニングギャップを重要な参照レベルとして扱うICTトレーダー
自動化されたギャップゾーンの可視化を求めるスマートマネーコンセプト(SMC)トレーダー
週間および日次の流動性プールを追跡する機関フローアナリスト
セッション開始を方向性バイアスフィルターとして使用する日中トレーダー
週間ギャップフィルをトレード計画に取り入れるスイングトレーダー
チャート上でクリーンで一貫したギャップデータを視覚的な合流点として求めるアルゴリズムトレーダー
概要
カスタマーレビュー
5 | 0 % | |
4 | 100 % | |
3 | 0 % | |
2 | 0 % | |
1 | 0 % |


![「[Stellar Strategies] Inside Bar with Signals」ロゴ](https://cdn.ctrader.com/image/webp/1d9e8bfa-3b2c-4440-bb37-5856902008a7_30683)


![「[CB] Pivot Points Pro」ロゴ](https://cdn.ctrader.com/image/webp/43463c82-67b0-4f10-a4ba-901bba091d81_32594)