

설명
표준 상대 강도 지수(RSI)는 세계에서 가장 인기 있는 지표 중 하나이지만, 차트 하단에 단일 선을 그리는 방식은 구식 거래 방법입니다. 이는 진정한 모멘텀 변화, 가속도 및 시장 횡보를 파악하기 어렵게 만듭니다.
이 RSI Advanced는 이 고전적인 오실레이터를 완전히 재창조합니다. 신호선, 변동성 필터링 및 스마트 차트 페인팅을 도입하여 RSI를 포괄적이고 올인원 모멘텀 및 추세 추종 대시보드로 변모시킵니다.
주요 특징
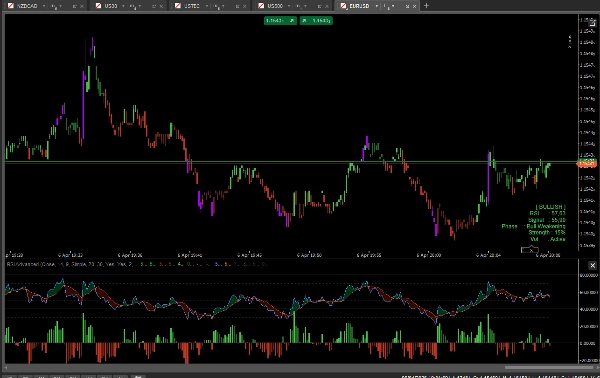
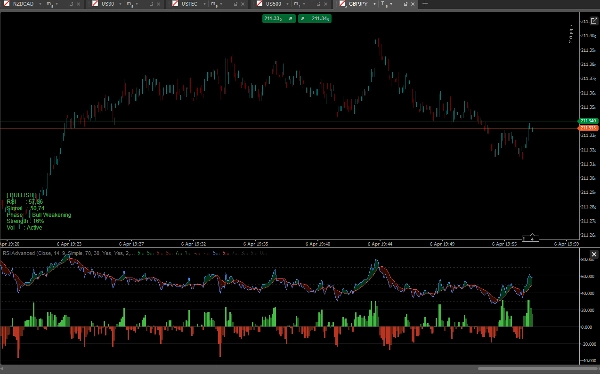
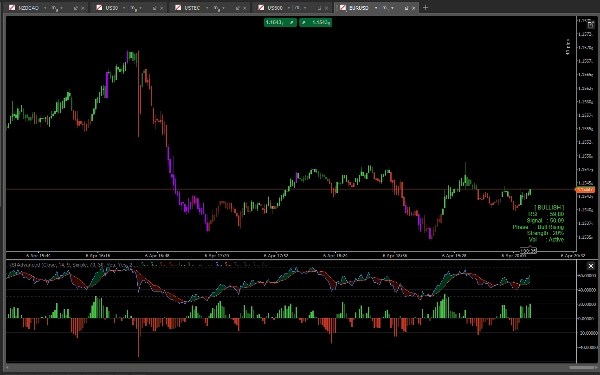
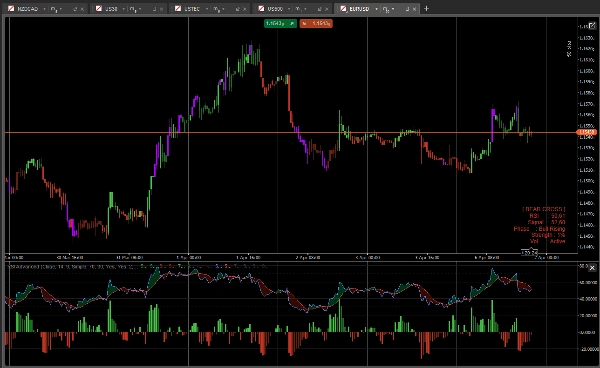
- RSI & 신호 클라우드: RSI에 이동 평균(신호선)을 추가했습니다. RSI와 신호선 사이 공간은 동적인 클라우드로 채워집니다. 클라우드가 녹색이면 강세가 모멘텀을 주도하는 것이고, 빨간색이면 약세가 지배하고 있음을 의미합니다.
- 모멘텀 히스토그램: 중앙에 위치한 히스토그램은 RSI와 신호선 사이의 정확한 거리를 추적합니다. 내장된 가속/감속 색상(밝음 대 어두움)으로 교차점과 모멘텀 소진을 미리 예측할 수 있습니다.
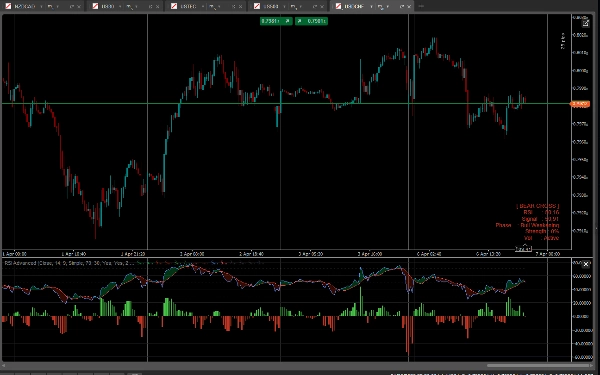
- 스마트 바 색상(페인트바): 기본 RSI 모멘텀에 따라 캔들스틱 색상이 변경됩니다:
-
- 밝은 녹색/빨간색: 강한 강세/약세 정렬(RSI > 50 및 RSI > 신호선).
- 어두운 녹색/빨간색: 약한 모멘텀 또는 되돌림.
- 보라색/마젠타: 극단적 과매수(OB) 또는 과매도(OS) 수준 – 잠재적 반전을 경고합니다.
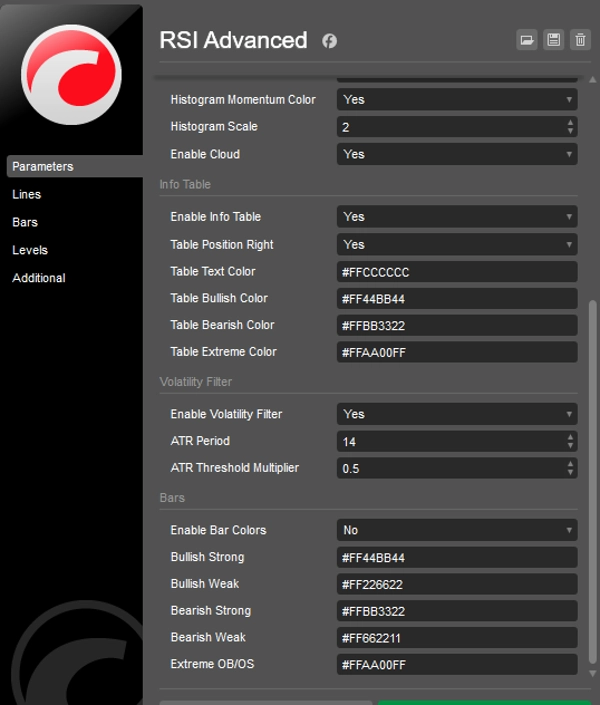
- 스마트 변동성 필터(ATR): 횡보장에 지쳐 있나요? 내장된 ATR 필터를 활성화하세요. 변동성이 과거 평균 이하로 떨어지면 캔들과 히스토그램이 회색으로 변해 나쁜 거래를 피할 수 있습니다.
- 차트 내 정보 대시보드: 세련된 데이터 패널이 실시간 지표를 표시합니다: 정확한 RSI 및 신호 값, 모멘텀 단계, 추세 강도 백분율, 변동성 상태.
- 완전한 잠금 해제: 모든 심볼(외환, 암호화폐, 지수, 주식)과 모든 시간대에서 제한 없이 거래할 수 있습니다. 평생 접근 권한 제공.
어떻게 거래하나요?
- 추세 지속: RSI가 50 중간선 위에 머무르면서 신호선 쪽으로 약간 하락하는 되돌림을 찾으세요. 히스토그램이 가속(밝은 녹색)되고 캔들이 밝은 녹색으로 변하면 강한 지속 진입 신호입니다.
- 반전: 캔들이 보라색(극단적 OB/OS)으로 변할 때, RSI가 신호선을 다시 넘어서고(클라우드 색상 변경) 높은 확률의 반전 설정을 기다리세요.
- 횡보 회피: 변동성 필터가 바를 회색으로 바꾸면, 그냥 기다리면서 시장이 깨어나길 기다리세요.
요약
지표 프로필
지표 카테고리
변동성
출력 유형
필터
데이터 요구 사항
막대만
지원되는 신호
크로스
추세 강도
변동성
고객 리뷰
5.0
리뷰: 1
5 | 100 % | |
4 | 0 % | |
3 | 0 % | |
2 | 0 % | |
1 | 0 % |
고객 리뷰
April 11, 2026
The first thing that worked was timing feels less random, and a small account test feels safer.
상담
자주 묻는 질문(FAQ)
BTCUSD
Forex
Signal
Indices
EURUSD
Commodities
GBPUSD
NZDUSD
RSI
AI
XAUUSD
NAS100
ATR
USDJPY
트레이딩 봇, 지표, 플러그인 등 cTrader Store에서 제공되는 상품은 제3자 개발자에 의해 제공되며, 이는 단순히 정보 및 기술적 접근을 목적으로 제공된 것입니다. cTrader Store는 중개인이 아니며, 투자 조언, 개인별 추천 또는 향후 성과에 대한 어떠한 보장도 제공하지 않습니다.


!["[Hamster-Coder] Moving Average MTF" 로고](https://cdn.ctrader.com/image/webp/b11b98b1-194d-4b8e-b00e-d611826ad159_31226)

가격
24
판매
661
무료 설치