
说明
═══════════════════════════════════════════════════════════════
EMA MTF TREND PRO — 多时间框架趋势分析指标
cTrader 覆盖指标
═══════════════════════════════════════════════════════════════
在一个表格中查看跨越6个时间框架的完整趋势图景,
在一张图表上,无需切换窗口。
───────────────────────────────────────────────────────────────
它的功能
───────────────────────────────────────────────────────────────
EMA MTF Trend Pro 结合了EMA趋势方向、Wilder通道
结构、基准线水平、ADX强度、交叉信号,
以及动量衰竭,集成于一个实时仪表盘中。
表格中的每一行代表一个不同的时间框架。每一列
回答关于该时间框架的不同问题。一眼即可
判断时间框架是否一致——以及是否安全进入。
───────────────────────────────────────────────────────────────
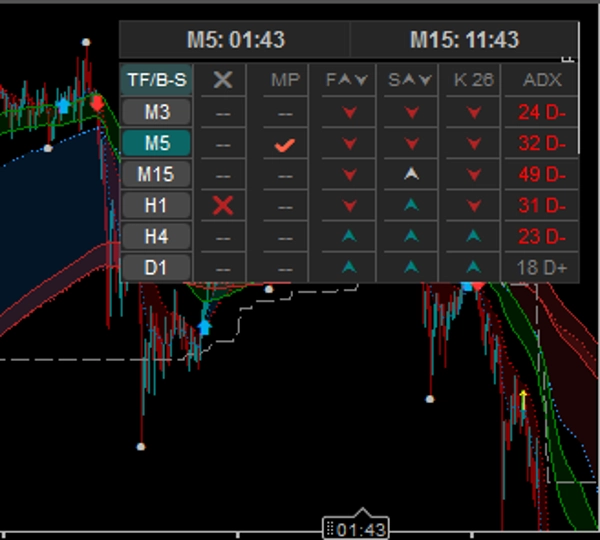
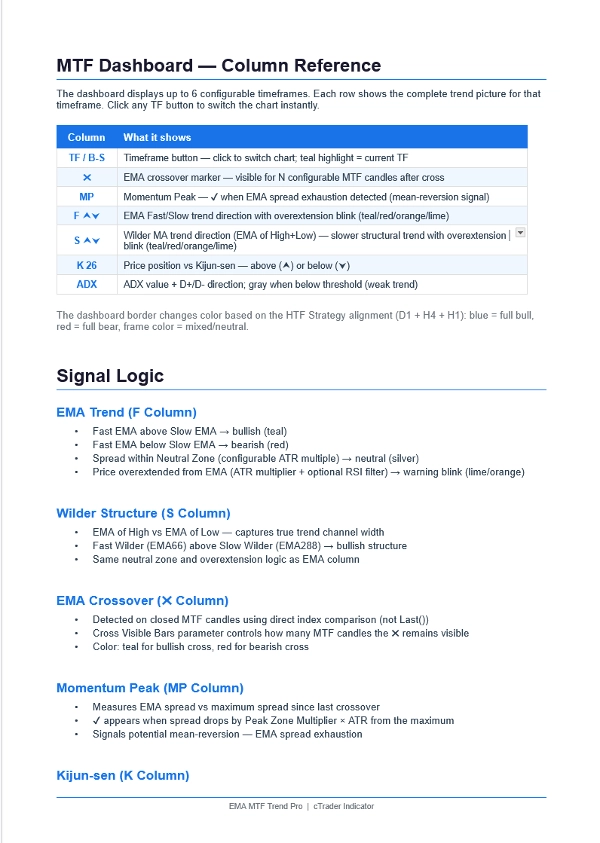
仪表盘 — 6个时间框架 × 7列
───────────────────────────────────────────────────────────────
列 显示内容
──────── ──────────────────────────────────────────────────
TF/B-S 时间框架按钮 — 点击即可即时切换图表
青绿色高亮 = 当前显示的时间框架
✖ EMA交叉 — 可见于N根可配置的蜡烛
青绿色 = 多头交叉 | 红色 = 空头交叉
MP 动量峰值 — ✔ 表示EMA价差耗尽
均值回归警告信号
F ⮝⮟ EMA快线与慢线趋势方向
青绿色 = 上升 | 红色 = 下降 | 银色 = 中性
当价格远离EMA时闪烁
S ⮝⮟ Wilder移动平均结构(高/低的EMA)
更慢,更具结构性的趋势过滤器
K 26 价格与基准线比较
⮝ = 价格在上方(支撑) | ⮟ = 在下方(阻力)
ADX 趋势强度 + D+/D- 方向
灰色 = 市场疲软/震荡(低于阈值)
───────────────────────────────────────────────────────────────
功能特点
───────────────────────────────────────────────────────────────
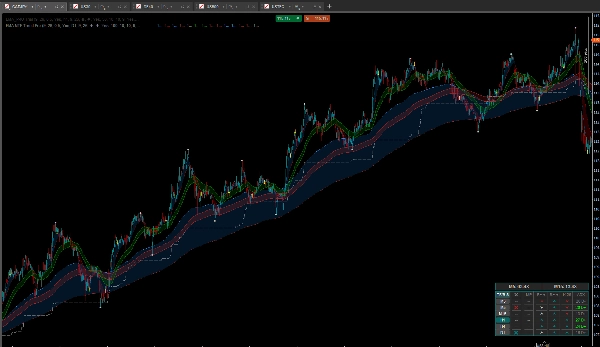
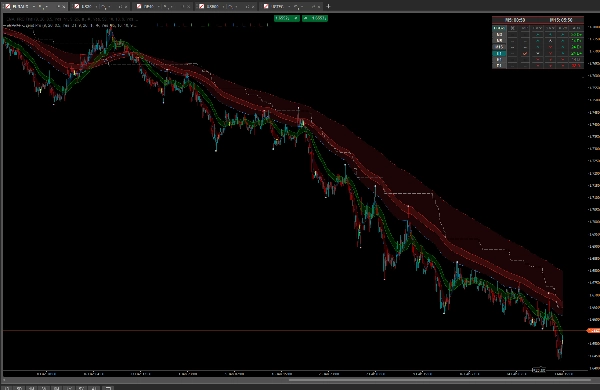
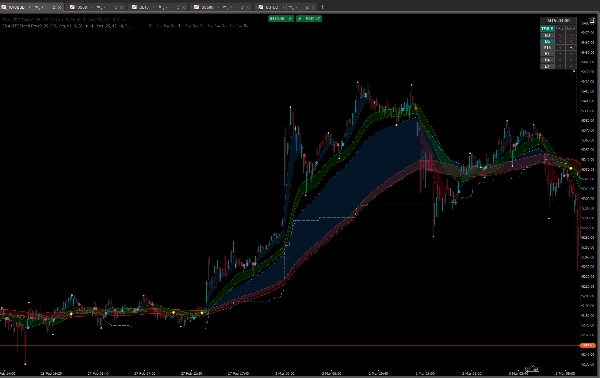
EMA云系统
• 快速+慢速EMA带有彩色云层填充
• 中性区域检测(可配置ATR倍数)
• 过度延伸警报带RSI过滤器
多时间框架EMA覆盖
• 将任何更高时间框架的EMA投影到当前图表
• 线性插值 — 平滑线条,无阶梯
• 交叉箭头带可配置符号和颜色
• 当仪表盘选择更高时间框架时自动隐藏覆盖箭头
(防止视觉混乱)
波段高点与低点
• 交替显示SH / SL点 — 无重复连续高点
• 可选SH / SL文本标签,基于ATR定位
• 可配置点大小、标签大小、颜色
• 整个波段显示的单一开关
基准线(Kijun-sen)
• 标准Hosoda定义(匹配TradingView / MT4)
• 可配置周期
• 也可作为多时间框架覆盖线显示在图表上
MA-Wilder通道
• 高点EMA和低点EMA — 形成趋势通道
• 快速通道(EMA66)+ 慢速通道(EMA288)
• 可在图表上显示,也可作为多时间框架覆盖
高时间框架策略边框
• 当D1 + H4 + H1均为多头(EMA + Wilder一致)时,仪表盘边框变为青绿色
• 当三者均为空头时变为红色
• 即时视觉确认完整多时间框架一致性
蜡烛倒计时计时器
• 双计时器 — 任意两个时间框架
• 第二计时器可跟随当前图表时间框架
• 单列模式下紧凑布局
紧凑/完整模式
• 点击TF/B-S标题切换
• 完整模式:7列(所有信号)
• 紧凑模式:3列(时间框架,EMA,Wilder)— 占用空间最小
───────────────────────────────────────────────────────────────
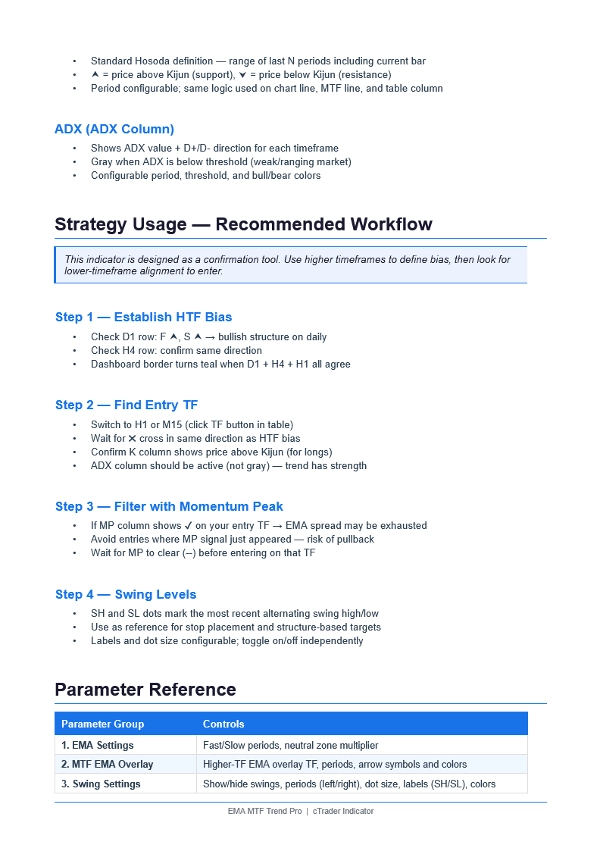
策略 — 如何使用
───────────────────────────────────────────────────────────────
第1步 — 确立偏向(更高时间框架)
• D1行:F ⮝ + S ⮝ = 多头日结构
• H4行:相同方向 = 趋势确认
• 仪表盘边框变为青绿色 = D1 + H4 + H1 全部一致
第2步 — 寻找入场点(更低时间框架)
• 点击表格中的H1或M15切换图表
• 等待✖交叉与高时间框架偏向方向一致
• K列显示⮝(价格高于基准线)表示多头
• ADX列激活,非灰色(趋势有强度)
第3步 — 用动量峰值过滤
• MP列显示✔ → EMA价差耗尽 → 避免入场
• 等待MP清除(--)后再入场
• 在更低时间框架使用,避免在EMA极端位置入场
第4步 — 使用波段水平
• SH点 = 最近波段高点(阻力/止损参考)
• SL点 = 最近波段低点(支撑/目标参考)
• 点交替出现 — 同时只有一个高点和一个低点
───────────────────────────────────────────────────────────────
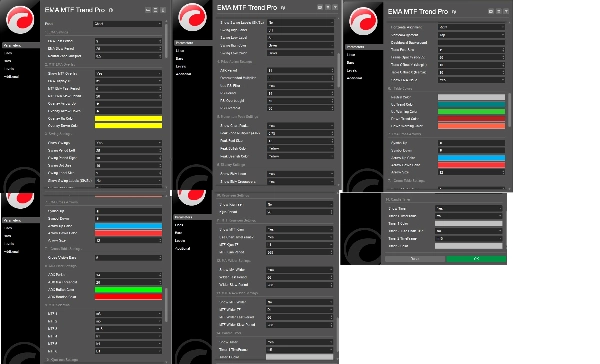
参数组
───────────────────────────────────────────────────────────────
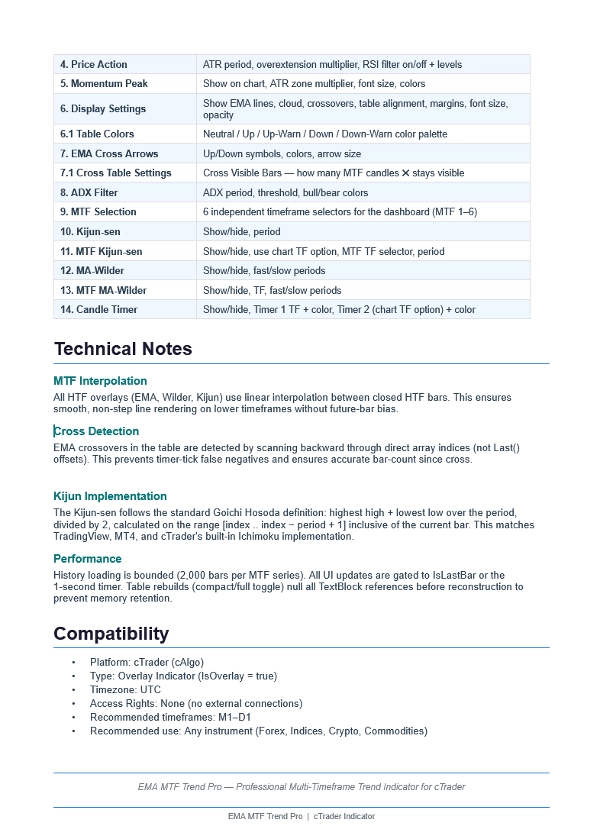
1. EMA设置 — 快速/慢速周期,中性区域
2. 多时间框架EMA覆盖 — 时间框架,周期,箭头样式
3. 波段设置 — 显示/隐藏,周期,标签,颜色
4. 价格行为 — ATR,过度延伸,RSI过滤器
5. 动量峰值 — 区域倍数,字体,颜色
6. 显示设置 — 线条,云层,表格布局
6.1 表格颜色 — 完整色彩调控
7. EMA交叉箭头 — 符号,颜色,大小
7.1 交叉表设置 — 交叉可见柱(N根蜡烛)
8. ADX过滤器 — 周期,阈值,颜色
9. 多时间框架选择 — 6个独立时间框架选择器
10. 基准线 — 显示/隐藏,周期
11. 多时间框架基准线 — 时间框架,周期,图表时间框架选项
12. MA-Wilder — 显示/隐藏,快/慢周期
13. 多时间框架MA-Wilder — 时间框架,快/慢周期
14. 蜡烛计时器 — 时间框架,颜色,图表时间框架选项
───────────────────────────────────────────────────────────────
摘要
客户评价
5 | 0 % | |
4 | 100 % | |
3 | 0 % | |
2 | 0 % | |
1 | 0 % |


