
Penerangan
TP_SL Alat Risiko & Ganjaran yang Sangat Berguna (Gaya TradingView)
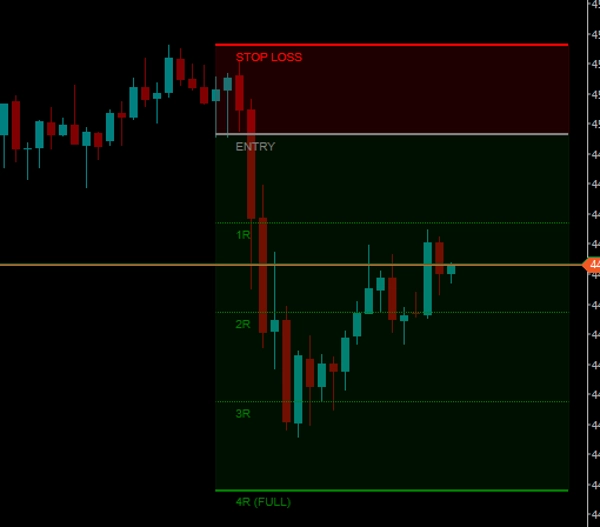
Bawa alat Posisi Panjang/Pendek gaya TradingView yang terbaik terus ke carta cTrader anda!
Jika anda pernah terlepas alat lukisan yang pantas, intuitif, dan interaktif untuk merancang dagangan anda, mengira risiko, dan meramalkan tahap Ambil Untung secara visual, penunjuk ini adalah untuk anda. Direka untuk kelajuan dan estetika carta yang bersih, ia membolehkan anda memetakan persediaan dagangan anda dalam kurang dari satu saat.
🔥 Ciri Utama:
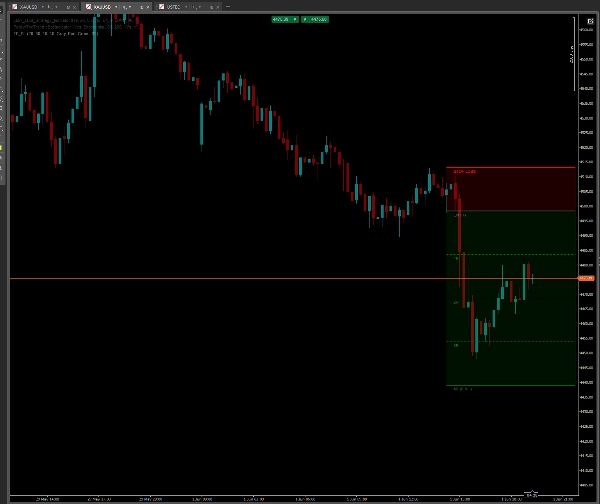
- Pengalaman TradingView dalam cTrader: Meniru alat posisi Panjang/Pendek visual yang popular.
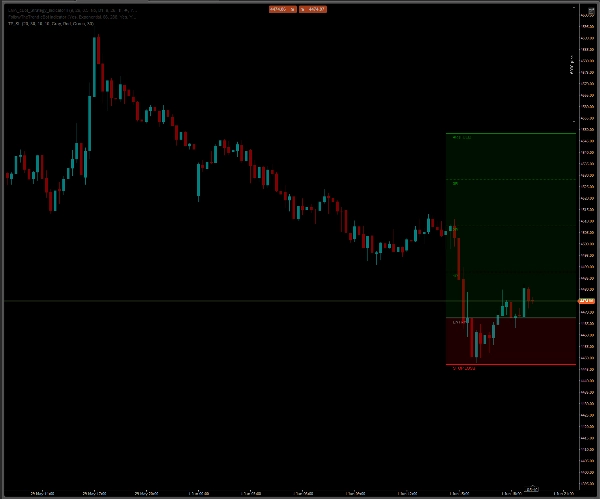
- Auto-Flip Pintar (Panjang/Pendek): Beralih dengan lancar antara posisi Panjang dan Pendek. Cuma seret garis Stop Loss di atas garis Masuk anda, dan zon Ambil Untung akan segera terbalik ke bawah.
- Ganda Risiko Automatik (R-Math): Mengira risiko anda (1R) secara automatik berdasarkan jarak antara Masuk dan Stop Loss, dan meramalkan tahap Ambil Untung yang tepat untuk 1R (Risiko Percuma), 2R, 3R, dan 4R (TP Penuh).
- Teknologi Carta Bersih: Berbeza dengan garis mendatar standard yang memanjang tanpa had ke kiri dan mengacaukan data sejarah anda, alat ini menggunakan garis terhad. Ia mencipta blok kemas dan berdiri sendiri yang kekal tepat di tempat anda perlukan.
- Penjejakan Harga Dinamik: Apabila lilin baru dicetak, alat ini secara automatik "terapung" ke kanan, kekal dekat dengan tindakan harga semasa.
⚡ Cara Menggunakannya:
- Lukis: Tahan kekunci SHIFT dan Klik-Kiri di mana-mana pada carta. Persediaan akan muncul serta-merta.
- Laraskan: Cuma Seret & Lepas garis "MASUK" kelabu atau garis "STOP LOSS" merah ke tahap harga yang anda inginkan. Keseluruhan grid mengira dan melaraskan secara masa nyata.
- Padam: Klik pada sama ada garis Masuk atau Stop Loss dan tekan kekunci Padam pada papan kekunci anda. Penunjuk ini mempunyai fungsi pembersihan automatik yang akan segera mengeluarkan keseluruhan lukisan, meninggalkan tiada kekacauan.
⚙️ Tetapan Boleh Disesuaikan Sepenuhnya:
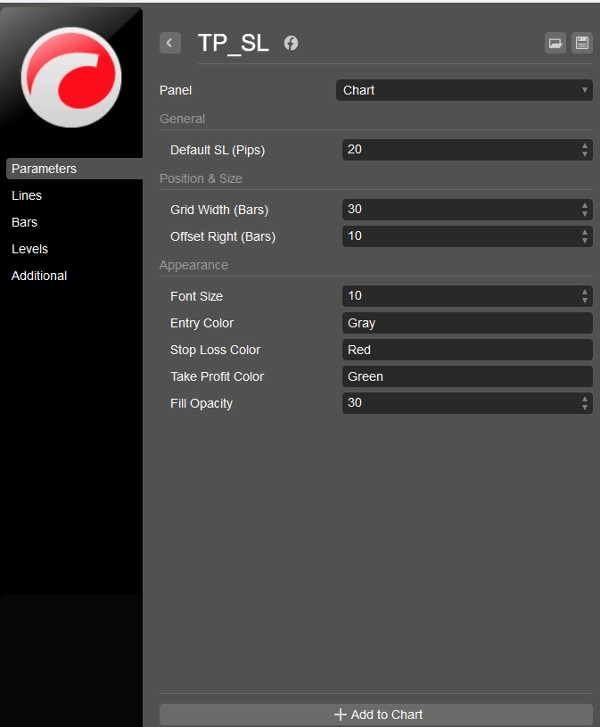
- Lebar & Offset Grid: Laraskan panjang alat (dalam bar) dan sejauh mana ia duduk dekat dengan harga semasa.
- Visual: Kawalan penuh ke atas warna. Taip mana-mana nama warna standard (contoh, DodgerBlue, Oren, Kelabu) untuk garis Masuk, SL, dan TP.
- Ketelusan: Laraskan ketelusan zon latar belakang (dari 0 hingga 255) untuk penampilan licin seperti kaca.
- Saiz Teks: Sesuaikan label pada carta agar sesuai dengan resolusi skrin anda.
Berhenti meneka sasaran anda. Rancang dagangan anda secara visual, hormati pengurusan risiko anda, dan kekalkan carta anda dengan kemas sempurna!
Penunjuk ini adalah PERCUMA sepenuhnya untuk komuniti cTrader.
Ringkasan
Key features include a smart auto-flip function that switches between long and short positions by dragging the stop loss line above or below the entry line, clean bounded lines that avoid cluttering historical data, and dynamic price tracking that keeps the tool aligned with current price action. Users can draw the setup by holding SHIFT and left-clicking, then adjust levels with drag-and-drop, and delete the drawing with a single key press.
The indicator offers full customization of grid width, offset, colors, opacity, and text size to fit individual chart preferences. It supports visualization on bar-based data and is categorized under pattern indicators with a focus on key levels. TP_SL aims to facilitate precise trade planning and risk management while maintaining clean chart aesthetics.


















![Logo "Session Volume Profile (SVP) [Iridio Capital]"](https://cdn.ctrader.com/image/webp/b058beb7-b143-45f3-87d0-8c524c00b203_61552)