설명
HCCC MTF - 허스트 사이클 복합 채널 (100% 무료)
개요
HCCC MTF (허스트 사이클 복합 채널)는 고급의 완전 상호작용형 다중 시간 프레임(MTF) 대시보드 및 채널 지표입니다. J.M. 허스트의 주기 이론과 ATR 변동성을 결합하여, 이 도구는 여러 시간 프레임에서 동시에 진정한 시장 추세와 완벽한 주기 전환점(고점과 저점)을 식별하는 데 도움을 줍니다.
두 번째는 https://ctrader.com/products/3618?u=cLogic와 함께 반자동 거래에 전념합니다
중요: 이 지표는 모두에게 완전히 100% 무료입니다. 이는 특별히 "Follow The Trend XAU Edition" cBot의 궁극적인 시각적 동반자로 개발되었습니다.
수동 거래에 완벽하게 사용할 수 있지만, 진정한 힘은 반자동 설정에서 발휘됩니다: HCCC 대시보드를 사용하여 상위 시간 프레임의 사이클과 모멘텀을 읽고, 그 방향으로 거래를 정확히 실행하고 관리하기 위해 Follow The Trend XAU Edition cBot을 활성화합니다.
주요 특징
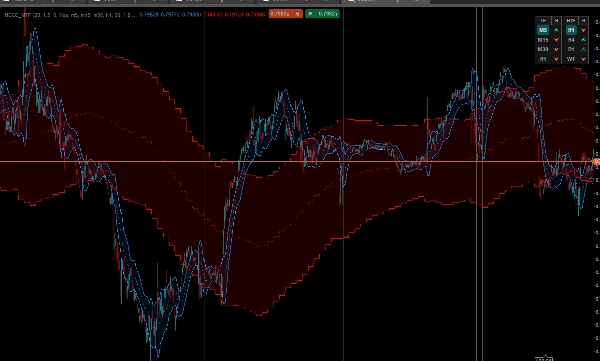
1. 상호작용형 MTF 대시보드 (클릭 가능)
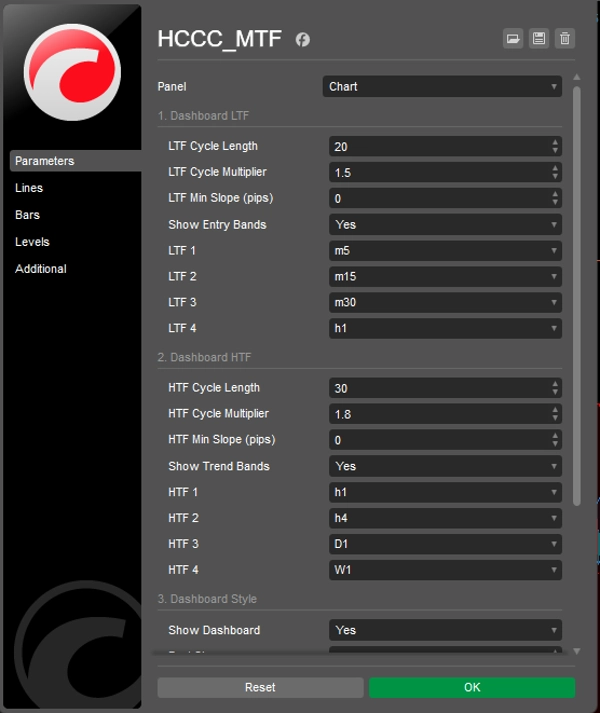
차트 간 전환을 잊으세요. 차트 내 대시보드는 4개의 하위 시간 프레임(LTF)과 4개의 상위 시간 프레임(HTF)을 추적합니다.
- LTF 버튼: 원하는 LTF 버튼을 클릭하여 현재 차트의 시간 프레임을 즉시 변경하세요.
- HTF 버튼: 원하는 HTF 버튼을 클릭하여 해당 상위 시간 프레임의 채널을 현재 차트에 직접 투영하세요!
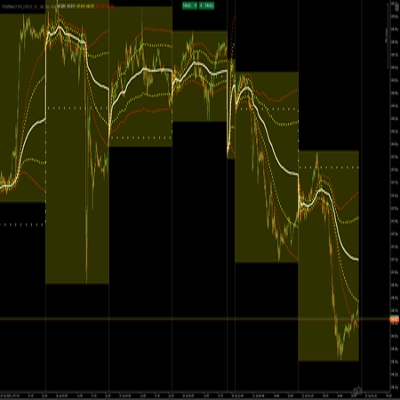
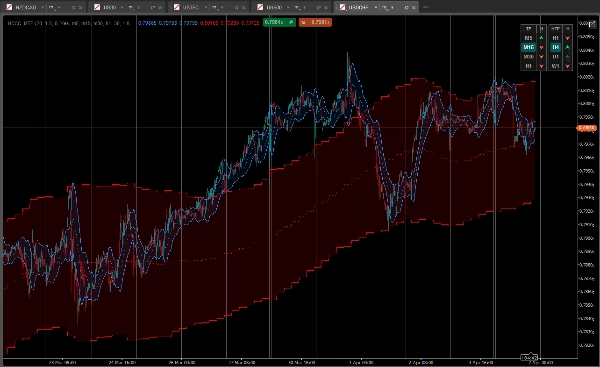
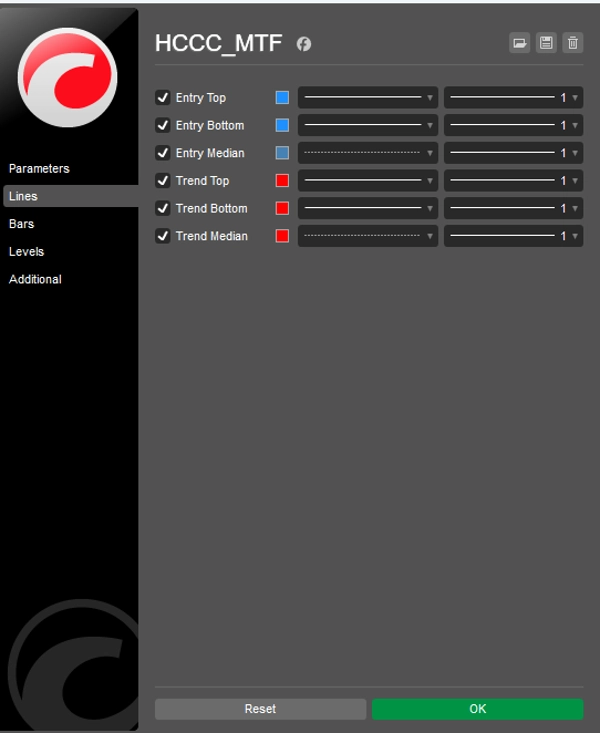
2. 이중 채널 오버레이 시스템
이 지표는 차트에 두 개의 우아하고 구름으로 채워진 채널을 동시에 표시합니다:
- 진입 사이클 (파란 구름): 현재 차트 시간 프레임을 기반으로 허스트 사이클을 계산합니다.
- 추세 사이클 (빨간 구름): 대시보드에서 선택한 상위 시간 프레임에서 계산된 매크로 뷰 채널입니다.
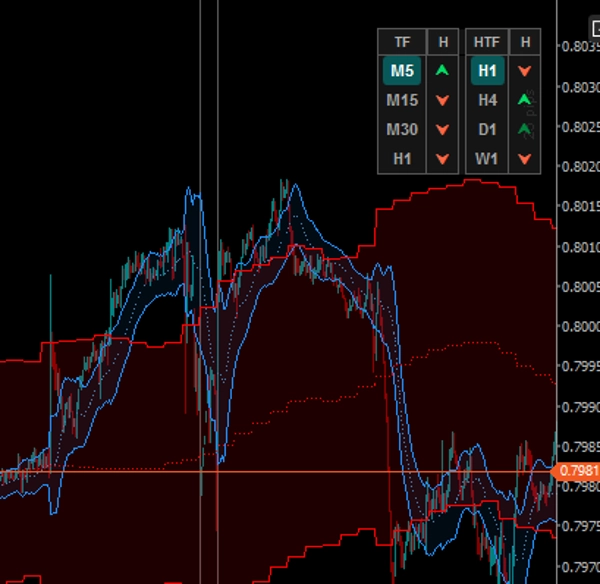
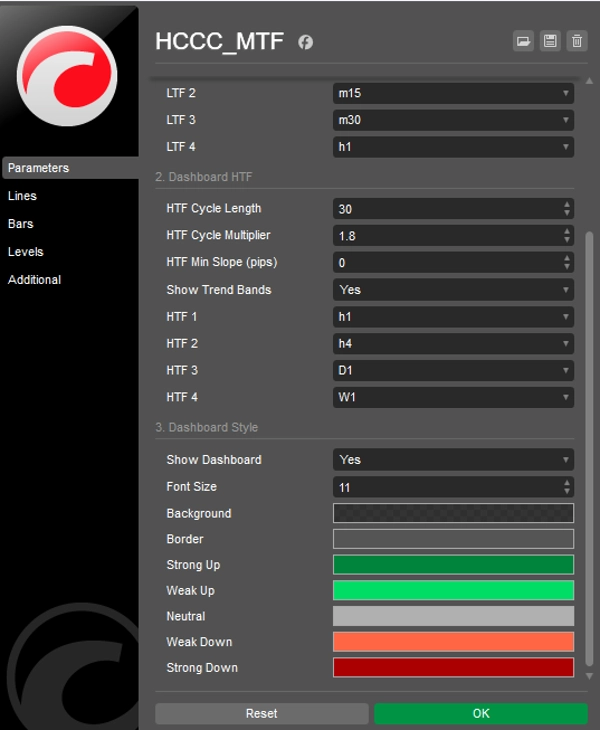
3. 고급 5단계 주기 신호
대시보드는 단순히 추세 방향만 보여주는 것이 아니라, 중앙선의 기울기와 가격이 ATR 밴드에 대해 위치한 상태를 분석하여 사이클의 단계를 표시합니다.
- [ ⮝ ] 진한 녹색 (강한 매수): 중앙선 기울기가 상승 중이며 가격이 하단 밴드까지 떨어졌습니다. 이는 주기 저점(딥 매수)입니다.
- [ ⮝ ] 연한 녹색 (약한 매수): 추세는 상승 중이지만 가격이 중앙선 또는 상단 밴드 근처에 머무르고 있습니다.
- [ — ] 회색 (중립): 사이클이 평평합니다. 명확한 모멘텀이 없습니다.
- [ ⮟ ] 연한 빨강 (약한 매도): 추세는 하락 중이지만 가격이 중앙선 근처에 있습니다.
- [ ⮟ ] 진한 빨강 (강한 매도): 중앙선 기울기가 하락 중이며 가격이 상단 밴드까지 상승했습니다. 이는 주기 고점(랠리 매도)입니다.
"Follow The Trend XAU Edition" cBot과 함께 사용하는 방법?
- 대시보드 오른쪽(HTF 열)을 보세요. 상위 시간 프레임(예: H4 및 D1)에서 진한/연한 녹색 화살표가 명확히 정렬될 때까지 기다리세요.
- 대시보드 왼쪽(LTF 열)을 보면서 국소적 되돌림(예: M15에서 진한 녹색 "강한 매수" 화살표)을 찾으세요.
- MTF 논리가 정렬되면 "BUY" 방향으로 Follow The Trend XAU Edition cBot을 활성화하고 알고리즘이 진입, 추적 정지 및 위험 관리를 처리하도록 하세요.
사용자 지정
모든 것이 완전히 사용자 지정 가능합니다: 사이클 길이, ATR 배수, 노이즈 필터링을 위한 최소 기울기 민감도(핍 단위), UI 색상 및 위치에 대한 완전한 제어.
지금 무료로 다운로드하고 반자동 거래를 한 단계 업그레이드하세요!
요약
It overlays two cloud-filled channels: a blue "Entry Cycle" channel based on the current timeframe and a red "Trend Cycle" channel derived from a selected higher timeframe. The dashboard provides advanced five-state cyclic signals indicating strong or weak buy/sell conditions and neutral phases by analyzing the slope of the median line and price position relative to ATR bands.
The indicator is fully customizable, including cycle lengths, ATR multipliers, slope sensitivity, and UI appearance. It is intended to complement the "Follow The Trend XAU Edition" cBot by providing visual cycle and momentum analysis to guide semi-automated trade execution and management. The HCCC MTF supports various markets including Forex, commodities, indices, stocks, and cryptocurrencies.