
설명
표준 지표와 달리, 이 도구는 스마트 라이브 신호를 특징으로 합니다: 현재 형성 중인 캔들에서 신호 화살표가 "깜박여" 잠재적 교차를 나타냅니다. 이는 캔들이 닫힐 때까지 신호가 아직 확정되지 않았음을 경고하여 잘못된 진입을 방지합니다.
https://ctrader.com/products/3618와 함께하는 반자동 거래 전용https://ctrader.com/products/3618?u=cLogic
주요 특징:
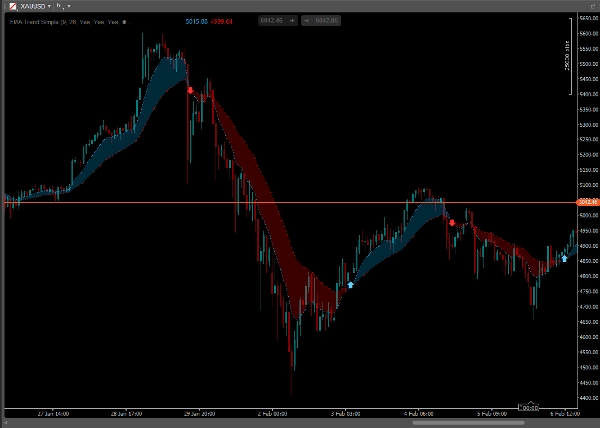
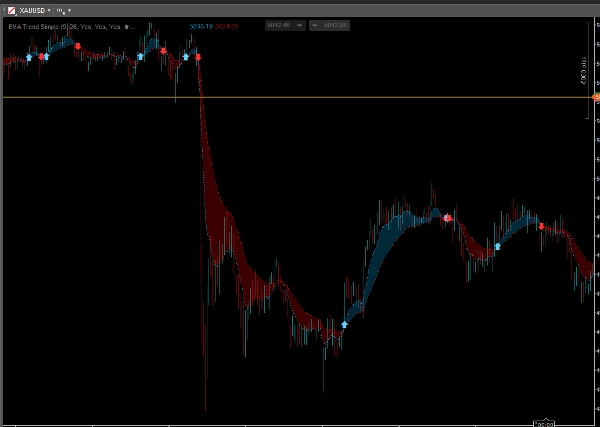
- ☁️ 트렌드 클라우드: 빠른 EMA와 느린 EMA 사이 공간을 투명한 구름으로 자동 채웁니다.
-
- 파란 구름: 상승 추세 (빠른 EMA > 느린 EMA).
- 빨간 구름: 하락 추세 (빠른 EMA < 느린 EMA).
- 🏹 교차 신호: 추세가 변할 때 정확히 맞춤형 화살표를 표시합니다.
- ⚠️ 스마트 "깜박임" 로직: 활성(마지막) 바에서 실시간으로 교차가 발생하면 화살표가 깜박입니다. 이는 미확인 신호에 속지 않고 시장 변동성을 모니터링하는 데 도움을 줍니다. 캔들이 닫히면 신호는 영구적(재도색 없음)이 됩니다.
- 🎨 완전한 사용자 정의 가능:
-
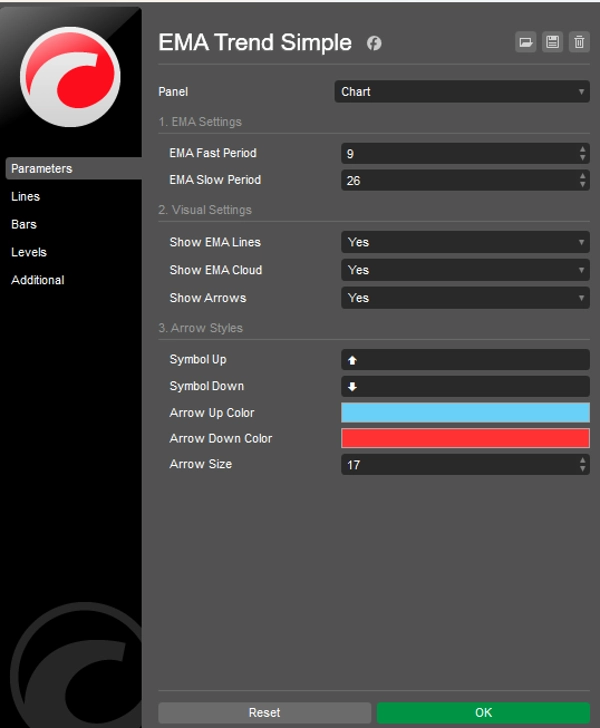
- EMA 기간 변경 (빠름/느림).
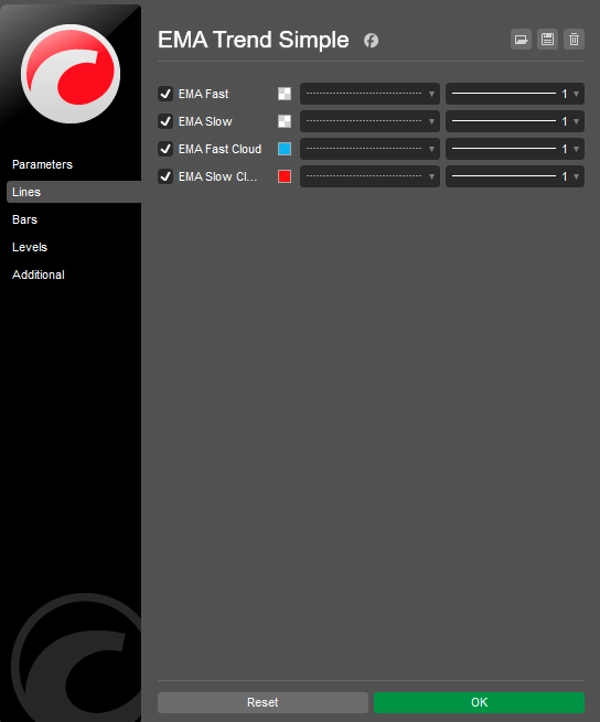
- 라인, 구름 또는 화살표를 독립적으로 켜고 끌 수 있습니다.
- 화살표 기호(텍스트/유니코드 사용), 색상 및 크기 사용자 정의.
읽는 방법:
- 매수 신호: 구름이 파란색으로 변하고 상승 화살표가 나타납니다.
- 매도 신호: 구름이 빨간색으로 변하고 하락 화살표가 나타납니다.
- 대기: 화살표가 깜박이면 캔들이 아직 닫히지 않은 상태입니다 – 신호를 확정하려면 닫힐 때까지 기다리세요.
매개변수:
- EMA 설정: 원하는 기간 설정 (기본값: 9 & 26).
- 시각적 요소: 차트를 깔끔하게 유지하기 위해 구름, 라인 또는 화살표를 켜고 끌 수 있습니다.
- 스타일링: 원하는 화살표 색상과 모양을 선택하세요.
요약
AI 요약
EMA Trend Simple is a trend-following indicator designed for clarity and ease of use. It visually represents market trends by filling the area between two exponential moving averages (EMAs) with a transparent cloud: blue for uptrends (fast EMA above slow EMA) and red for downtrends (fast EMA below slow EMA). The indicator provides crossover signals with customizable arrows that appear precisely when the trend changes.
A distinctive feature is the Smart Live Signal: on the current forming candle, the signal arrow blinks to indicate a potential crossover, helping traders avoid false entries by waiting for candle close confirmation. Once confirmed, signals become permanent and non-repainting.
Users can fully customize EMA periods, toggle visibility of lines, clouds, and arrows independently, and adjust arrow symbols, colors, and sizes. The indicator supports semi-automatic trading integration.
To interpret signals: a blue cloud with an up arrow suggests a buy, a red cloud with a down arrow suggests a sell, and blinking arrows indicate unconfirmed signals pending candle closure.
EMA Trend Simple is applicable across various markets including Forex, cryptocurrencies, and commodities, supporting trend analysis and scalping strategies. It requires bar data input and outputs visual trend signals and crossover alerts.
지표 프로필
지표 카테고리
추세
출력 유형
시각화
신호
데이터 요구 사항
막대만
지원되는 신호
크로스
고객 리뷰
0.0
리뷰: 0
고객 리뷰
이 상품에 대한 리뷰가 아직 없습니다. 이미 사용해 보셨나요? 다른 사람들에게 가장 먼저 소개해 주세요!
상담
자주 묻는 질문(FAQ)
BTCUSD
Prop
Forex
Scalping
EURUSD
Supertrend
Crypto
AI
XAUUSD
USDJPY
트레이딩 봇, 지표, 플러그인 등 cTrader Store에서 제공되는 상품은 제3자 개발자에 의해 제공되며, 이는 단순히 정보 및 기술적 접근을 목적으로 제공된 것입니다. cTrader Store는 중개인이 아니며, 투자 조언, 개인별 추천 또는 향후 성과에 대한 어떠한 보장도 제공하지 않습니다.


가격
24
판매
664
무료 설치