
설명
손익분기점 도달 시간 지표 LITE
라이트 버전
이것은 손익분기점 도달 시간 지표의 무료 체험 버전입니다. EURGBP로 제한됩니다 그리고 2분 동안만 실행됩니다.
손익분기점 도달 시간 지표
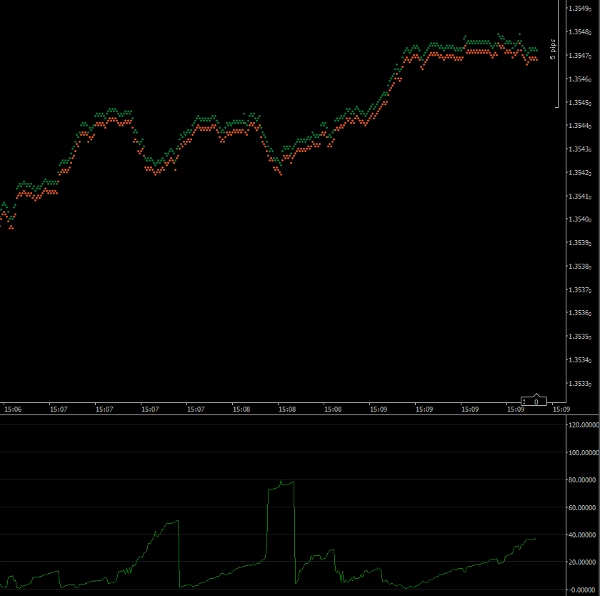
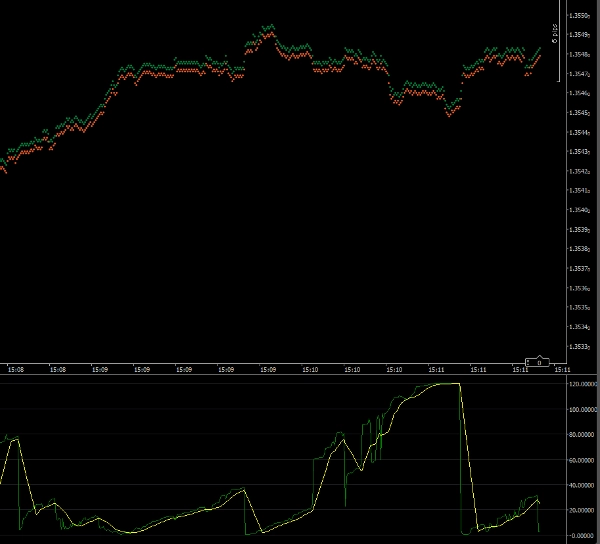
이 지표는 거래가 시장에 진입하는 시점을 타이밍하는 데 도움을 줍니다. 플롯은 거래가 손익분기점에 도달하는 데 걸릴 것으로 예상되는 초 수를 보여줍니다. 시장이 빠르게 그리고 당신의 방향으로 움직이면 지표는 작은 숫자를 표시합니다. 시장이 당신에게 불리하거나 느리게 움직이면 숫자가 더 커집니다.
이 지표는 거래가 손익분기점에 도달하는 데 필요한 핍 수를 계산합니다. 그런 다음 현재 가격이 움직이는 속도와 비교합니다.
참고: 이 지표는 1틱 타임 프레임에서 실행해야 합니다.
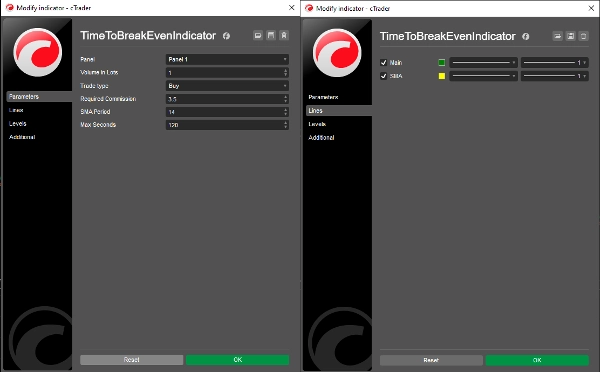
매개변수
로트 단위 거래량: 제안된 거래의 거래량
거래 유형: 매수 또는 매도 여부
필요한 수수료: 거래에 발생하는 수수료 (Quick Trade 창에서 확인 가능)
SMA 기간: 단순 이동평균 플롯의 기간 (기본값 = 14)
최대 초: 기록할 최대 초 수 (아래 참조)
선
메인: 지표 플롯 선 (기본값 = 녹색)
SMA: 단순 이동평균 플롯 선 (기본값 = 노란색)
최대 초
지표가 매우 큰 값을 표시하도록 허용하면, 손익분기점 도달 시간이 짧을 때 지표의 스케일 때문에 세부 사항을 볼 수 없습니다. 이 매개변수를 설정하면 지표의 최대 스케일을 설정할 수 있습니다. 기본값은 120초(2분)로 설정되어 있습니다. 따라서 2분 이상인 출력은 120초로 표시됩니다.
앤디 라킨 박사
저작권 2025, 판권 소유
2025년 5월 26일
법적 고지
이 지표의 결과는 실거래에 사용하기 전에 정확성을 확인해야 합니다.
이 지표 결과에 대해 어떠한 보증도 제공하거나 암시하지 않습니다.
이 지표 사용으로 인한 손실에 대해 어떠한 책임도 지지 않습니다.


!["[Hamster-Coder] Price" 로고](https://cdn.ctrader.com/image/webp/893fb641-d5b3-44d8-91fb-6a2dc6f3d309_30647)
