
설명
손익분기점 표시기 v2
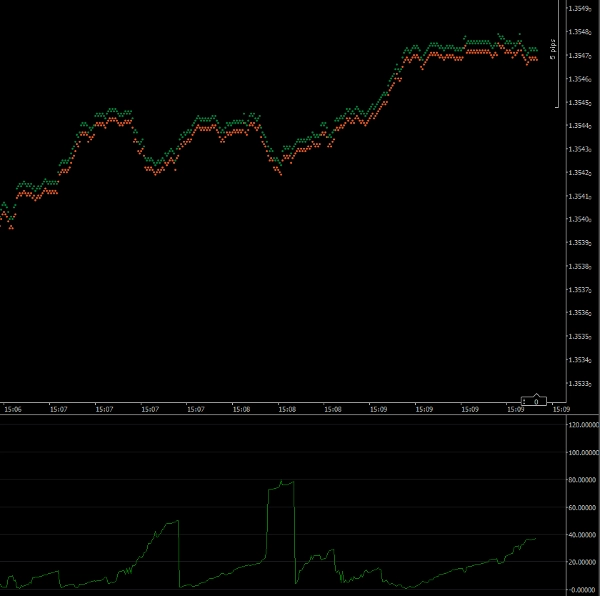
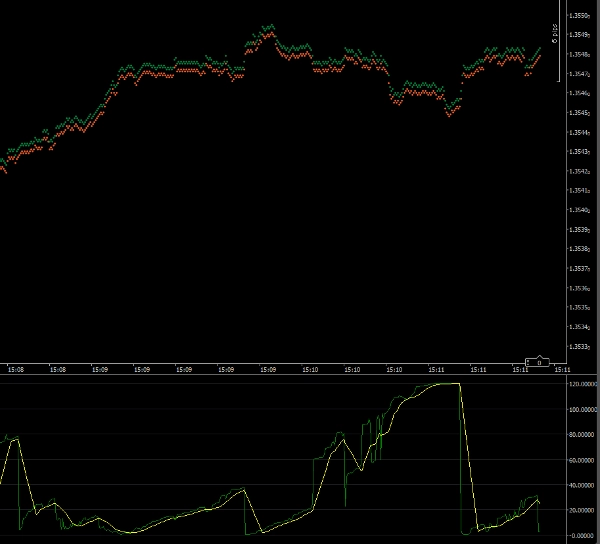
이 표시기는 거래 진입 시점을 타이밍하는 데 도움을 줍니다. 그래프는 거래가 손익분기점에 도달하는 데 걸릴 것으로 예상되는 초 수를 보여줍니다. 시장이 빠르게 그리고 당신의 방향으로 움직이면 표시기는 작은 숫자를 표시합니다. 시장이 반대 방향이거나 느리게 움직이면 숫자가 더 커집니다.
이 표시기는 거래가 손익분기점에 도달하는 데 필요한 핍 수를 계산합니다. 그런 다음 현재 가격이 움직이는 속도와 비교합니다.
참고: 이 표시기는 1틱 타임 프레임에서 실행해야 합니다.
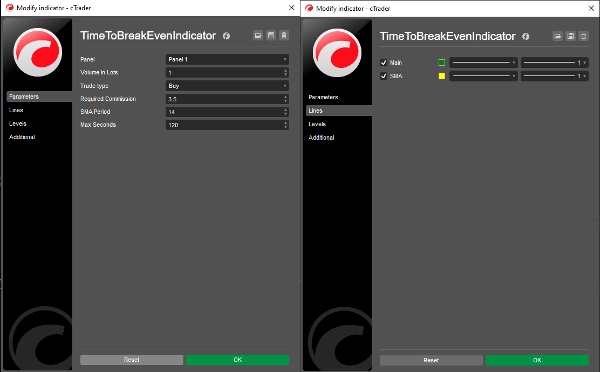
매개변수
거래량(랏 단위): 제안된 거래의 거래량
거래 유형: 매수 또는 매도 여부
필요 수수료: 거래에 부과되는 수수료 (퀵 트레이드 창에서 확인 가능)
SMA 기간: 단순 이동평균선 기간 (기본값 = 14)
최대 초: 기록할 최대 초 수 (아래 참조)
선
메인: 표시기 그래프 선 (기본값 = 녹색)
SMA: 단순 이동평균선 그래프 선 (기본값 = 노란색)
최대 초
표시기가 매우 큰 값을 표시하도록 허용하면 손익분기점까지 시간이 짧을 때 세부 사항을 보기 어렵게 됩니다. 이 매개변수를 설정하면 표시기의 최대 스케일을 지정할 수 있습니다. 기본값은 120초(2분)입니다. 따라서 2분 이상인 출력은 120초로 표시됩니다.
앤디 라킨 박사
저작권 2025, 판권 소유
2025년 5월 26일
법적 고지
이 표시기의 결과는 실거래에 사용하기 전에 정확성을 확인해야 합니다.
이 표시기의 결과에 대해 어떠한 보증도 제공하거나 암시하지 않습니다.
이 표시기를 사용하여 발생한 손실에 대해 어떠한 책임도 지지 않습니다.
요약
고객 리뷰
5 | 50 % | |
4 | 50 % | |
3 | 0 % | |
2 | 0 % | |
1 | 0 % |


!["Smart Money Concepts (SMC) [Iridio Capital]" 로고](https://cdn.ctrader.com/image/webp/28b69fd1-ef54-4bed-9487-07e78e883be4_40934)
!["Gaussian Channel [Iridio Capital]" 로고](https://cdn.ctrader.com/image/webp/7c039209-5573-4a54-a072-f9528b503103_41960)

