
الوصف
ثوّر تحليل المخططات الخاص بك
خطوة إلى مستقبل التحليل الفني مع Delta-RSI Candle Pro – المؤشر المبتكر الذي يحول الشموع العادية إلى مرئيات قوية للزخم. لماذا تملأ شاشتك بعدة مؤشرات بينما يمكنك الحصول على كل ما تحتاجه مباشرة على الشموع نفسها؟
الحل البصري الشامل للتداول
-
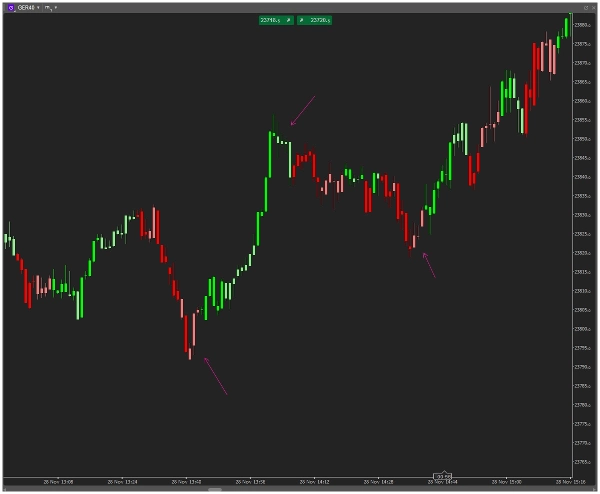
- التعرف الفوري على الإشارة: قوة واتجاه الزخم معروضان بشكل بديهي من خلال اللون
- تعظيم مساحة الشاشة: القضاء على لوحات المؤشرات المنفصلة إلى الأبد
- الدقة الرياضية: الانحدار متعدد الحدود المتقدم يحسب زخم RSI الحقيقي
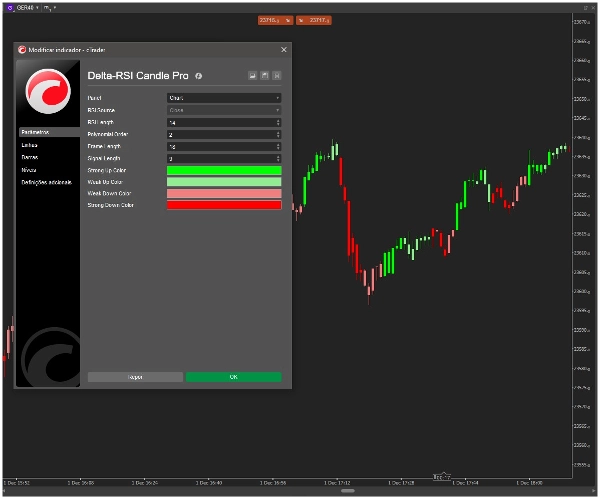
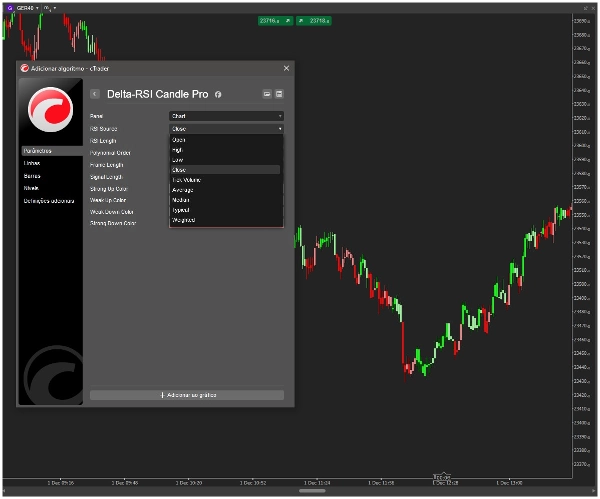
- التخصيص الكامل: استخدم منتقي الألوان الأصلي في cTrader لمطابقة أسلوب تداولك
- موثوق ودقيق: حسابات غير معادة الرسم بناءً على بيانات السعر المؤكدة
كيف يعمل Delta-RSI Candle Pro
خوارزمية الملكية الخاصة بنا تحسب المشتقة اللحظية لـ RSI باستخدام تركيب منحنى متعدد الحدود، ثم تعين ألوان ذكية لكل شمعة:
-
- صعودي قوي: أخضر مكثف – تسارع الزخم الإيجابي
- صعودي خفيف: أخضر فاتح – زخم إيجابي لكن ينصح بالحذر
- هبوطي خفيف: أحمر فاتح – زخم سلبي لكن احتمال انعكاس
- هبوطي قوي: أحمر عميق – تسارع الزخم السلبي
الميزات الرئيسية التي تميزنا
-
- 🎯 التكامل المباشر مع الشمعة: تظهر الألوان مباشرة على شموع التداول الخاصة بك
- 🎨 اختيار الألوان بصريًا: منتقي ألوان cTrader البديهي – لا حاجة لأسماء رموز
- ⚙️ قابل للتعديل بالكامل: ضبط طول RSI، ترتيب متعدد الحدود، وفترة النظر للخلف
- 🚀 أداء محسن: محرك حساب خفيف الوزن لتشغيل سلس
- 📊 خوارزمية بمستوى احترافي: تحليل مشتقة رياضية لإشارات متفوقة
من يستفيد أكثر؟
-
- متداولو اليوم بحاجة إلى مؤشرات زخم بصرية فورية
- متداولو السوينغ لتحديد تغيرات الاتجاه مبكرًا
- المتداولون البسطاء الذين يكرهون ازدحام المخطط
- المتداولون الخوارزميون باحثون عن تأكيد بصري
- جميع المتداولين الجادين الذين يريدون ميزة في تحليل السوق
ابدأ في ثوانٍ
-
- أضف Delta-RSI Candle Pro إلى مخططك
- اختر ألوانك المفضلة باستخدام منتقي الألوان البصري
- اضبط المعلمات لتتناسب مع إطار التداول الزمني الخاص بك
- شاهد على الفور أنماط الزخم تظهر على شموعك
التميز التقني
-
- نوع المؤشر التراكبي (لا لوحة منفصلة)
- خوارزمية غير معادة الرسم
- حساب مشتقة متعددة الحدود لـ RSI
- متوافق مع جميع الرموز والأطر الزمنية
- تحديثات وتحسينات منتظمة
لماذا هذا مختلف
بينما تضيف المؤشرات الأخرى تعقيدًا، يقوم Delta-RSI Candle Pro بتبسيط وتعزيز. لقد أخذنا تحليل الزخم الرياضي المتقدم وجعلناه بديهيًا بصريًا. لا مزيد من تقسيم الانتباه بين السعر والمؤشرات – الآن يعملون معًا كنظام متكامل واحد.
هل أنت مستعد لرؤية مخططاتك بطريقة ثورية جديدة؟...
الملخص
Key features include immediate visual signal recognition through candle coloring, elimination of separate oscillator panels to maximize chart space, and advanced mathematical precision with non-repainting calculations based on confirmed price data. Users can fully customize colors and parameters such as RSI length, polynomial order, and lookback period using cTrader’s native color pickers.
Delta-RSI Candle Pro is compatible with all symbols and timeframes and is optimized for smooth performance with a lightweight calculation engine. It is suitable for day traders, swing traders, minimalist traders, algorithmic traders, and others seeking clear, integrated momentum analysis without chart clutter. The indicator overlays directly on price candles, providing a cohesive system that combines price and momentum information visually.
تقييمات العملاء
5 | 100 % | |
4 | 0 % | |
3 | 0 % | |
2 | 0 % | |
1 | 0 % |


