
الوصف
مُصوّر الدعم والمقاومة المؤسسية
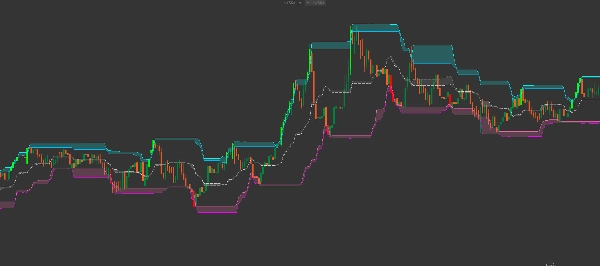
السحابة دونشيان الذكية للانعكاس هي قناة تقلبات من الجيل التالي مصممة لتحديد مناطق الانعكاس ذات الاحتمالية العالية. على عكس قنوات دونشيان القياسية التي تتتبع فقط أعلى القمم وأدنى القيعان، يقوم هذا المؤشر بتحليل العلاقة بين فتائل الشموع و أجسام الشموع لرسم "سحب الضغط".
تعمل هذه السحب كمناطق ديناميكية للعرض والطلب، تُظهر لك بالضبط أين من المحتمل أن يتوقف السوق أو ينعكس.
هيكل متعدد السحب متقدم
يتميز هذا المؤشر بنظام سحب متطور مكون من 3 طبقات:
-
- سحابة المقاومة (سماوي/أزرق): تقع في الأعلى، وتُظهر الفجوة بين أعلى فتيل وأعلى جسم شمعة. هذه هي "منطقة البيع".
- سحابة التوازن (رمادي/فضي): شريط مركزي يتتبع توازن السوق. يمثل نقطة القيمة العادلة بين الفتائل والأجسام.
- سحابة الدعم (وردي/ماجنتا): تقع في الأسفل، وتُظهر الفجوة بين أدنى فتيل وأدنى جسم شمعة. هذه هي "منطقة الشراء".
ميزات التداول الرئيسية
-
- مرشح تقلب ATR: يتضمن مضاعف ATR (المتوسط الحقيقي للنطاق) مدمجًا لتعويض طفيف للأشرطة الخارجية، مما يفلتر ضوضاء السوق و"مطاردات الإيقاف".
- تلوين الشموع الذكي: يبرز المؤشر تلقائيًا زخم الاختراق:
- شموع الليمون: أغلق السعر فوق سحابة المقاومة العليا (اختراق صعودي).
- الشموع الحمراء: أغلق السعر تحت سحابة الدعم السفلى (اختراق هبوطي).
- منطق الفتيل مقابل الجسم: من خلال رؤية "سمك السحابة"، يمكنك تقدير التقلب. السحابة السميكة تعني فتائل طويلة (رفض/تردد عالي)، بينما السحابة الرقيقة تعني حركة سعر قوية وحاسمة.
كيفية التداول باستخدام سحب دونشيان الذكية
1. الانعكاس المتوسط (سكالبينج) » ابحث عن دخول السعر إلى سحابة المقاومة دون الإغلاق فوقها. غالبًا ما يشير هذا إلى "خداع"، مما يدل على فرصة دخول قصيرة عالية الاحتمالية نحو الخط الأوسط.
2. اختراق الاتجاه » عندما تتحول الشمعة إلى ليمون (الإغلاق فوق مرشح الفتيل العلوي)، فهذا يشير إلى أن الثيران قد تجاوزوا منطقة المقاومة. هذه إشارة قوية لاستراتيجيات متابعة الاتجاه.
3. ارتداد الدعم » راقب سحابة الدعم (الوردي). عندما يلمس السعر هذه المنطقة خلال تراجع في اتجاه صاعد، فهي تمثل منطقة "شراء قيمة" حيث غالبًا ما يتدخل المشترون المؤسسيون.
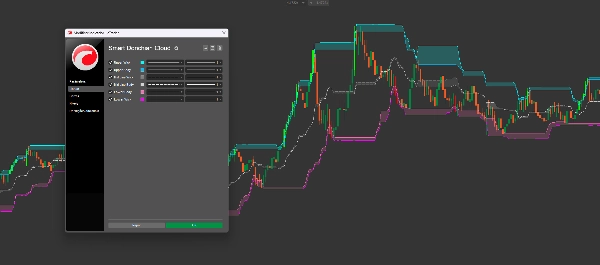
المعلمات الفنية
-
- الفترة: فترة النظر للخلف لحساب القمم والقيعان (الافتراضي: 20).
- مضاعف مرشح ATR: يضبط "التوسيع" حول الأطراف لتجنب الوقوع في الارتفاعات الطفيفة.
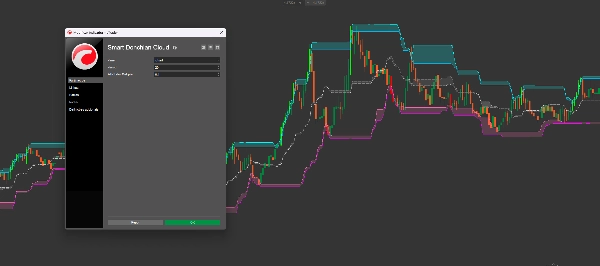
- ألوان قابلة للتخصيص بالكامل: خصص السحب العليا والوسطى والسفلى لتناسب قالب الرسم البياني الشخصي الخاص بك.
لماذا هذه الأداة ضرورية
يفشل معظم المتداولين لأنهم يعاملون الدعم والمقاومة كخطوط فردية. في الواقع، هي مناطق. تقوم سحابة دونشيان الذكية للانعكاس برسم هذه المناطق رياضيًا، مما يمنحك صورة أوضح لبنية السوق مقارنة بأي مؤشر قناة تقليدي.
الملخص
تقييمات العملاء
5 | 100 % | |
4 | 0 % | |
3 | 0 % | |
2 | 0 % | |
1 | 0 % |


![شعار "[Hamster-Coder] Moving Average MTF"](https://cdn.ctrader.com/image/webp/b11b98b1-194d-4b8e-b00e-d611826ad159_31226)
