
الوصف
🌐 تحول هيكل السوق – مذبذب هيكل السوق الاحترافي
تحديد اتجاه الاتجاه الحقيقي. تصفية الضوضاء. التداول بثقة.
تحول هيكل السوق هو مذبذب هيكلي للاتجاه من الجيل التالي مصمم للمتداولين الذين يرغبون في الوضوح والدقة والموثوقية في جميع ظروف السوق.
بدلاً من الاعتماد على المتوسطات المتحركة المتأخرة أو الأدوات القائمة على التقلبات، يركز هذا المؤشر على جوهر سلوك السعر: القمم المتأرجحة و القيعان المتأرجحة.
النتيجة هي نموذج اتجاه نظيف وسريع الاستجابة يساعدك على التعرف فورًا على:
- الانحياز الحقيقي للسوق
- انتقالات الهيكل
- قوة استمرار الاتجاه
- تحولات الزخم الخفية
سواء كنت تتداول بالتأرجح، أو التداول اليومي، أو تشغيل أنظمة خوارزمية، فإن تحول هيكل السوق يجلب إطار عمل هيكلي احترافي مباشرة إلى مخططك.
🔥 لماذا هيكل السوق مهم
تحلل معظم المؤشرات السعر بعد أن يتحرك بالفعل.
يعمل هيكل السوق بشكل مختلف — فهو يقيس أساس تطور الاتجاه:
- قمم أعلى / قيعان أعلى → هيكل صعودي
- قمم أدنى / قيعان أدنى → هيكل هبوطي
هذا يكشف عن الاتجاه الذي يبنيه السوق، وليس فقط ما يفعله السعر لحظة بلحظة.
يقوم تحول هيكل السوق بأتمتة هذه العملية بأكملها ويحولها إلى مذبذب سهل القراءة.
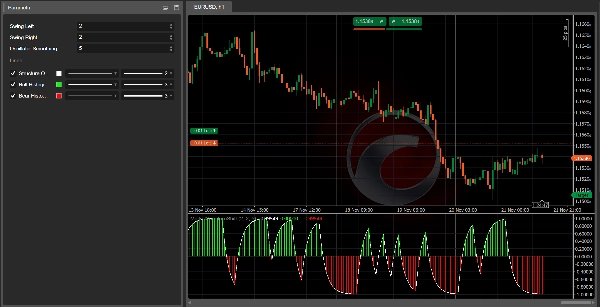
📊 ما يظهره المؤشر
✔ 1. خط مذبذب الهيكل (أبيض)
خط اتجاه مبسط قائم على المتوسط المتحرك الأسي يعرض الهيكل السائد بوضوح:
- فوق 0 → هيكل صعودي
- تحت 0 → هيكل هبوطي
- بالقرب من 0 → عدم استقرار الهيكل أو انتقال الاتجاه
نظرة واحدة تكشف مكان السوق الحقيقي.
✔ 2. المدرج التكراري الصعودي (أخضر)
يعرض القوة والزخم داخل هيكل صعودي.
الأعمدة الأقوى = ضغط صعودي أقوى.
مثالي لتأكيد إعدادات الشراء.
✔ 3. المدرج التكراري الهبوطي (أحمر)
يعرض الزخم وقوة الهيكل الهبوطي.
الأعمدة الأقوى = اتجاه هبوطي أقوى.
مثالي للتحقق من فرص البيع.
🎯 كيفية استخدام المتداولين له (سير عمل احترافي)
أ. فلتر تأكيد الاتجاه
تداول فقط في اتجاه الزخم الهيكلي:
- تداولات الشراء عندما يكون المذبذب فوق 0
- تداولات البيع عندما يكون المذبذب تحت 0
هذه القاعدة البسيطة وحدها تقضي على العديد من الإعدادات الخاطئة.
ب. كشف الانعكاس الهيكلي
الانتقالات الرئيسية مرئية عندما يعبر المذبذب خط الصفر:
- أحمر → أخضر = هيكل صعودي جديد
- أخضر → أحمر = هيكل هبوطي جديد
يوفر هذا رؤية مبكرة لتحولات الاتجاه قبل وقت طويل من استجابة الأدوات التقليدية.
ج. تحسين متعدد الأطر الزمنية
المؤشر قوي بشكل استثنائي في سير العمل متعدد الأطر الزمنية:
- استخدم H4/H1 لـ إطار الاتجاه
- استخدم M30/M15 لـ الدخول
منع التداولات المضادة للاتجاه وزيادة الدقة إلى أقصى حد.
د. التآزر مع إشارات هيكل السوق
يصبح تحول هيكل السوق نظام تداول كامل عند دمجه مع إشارات هيكل السوق، والتي توفر:
- أسهم شراء/بيع
- علامات تحول بصرية
- تنبيهات كسر هيكلي
معًا، يخلقون منهجية كاملة قائمة على الهيكل من الأعلى إلى الأسفل.
⚙️ مصمم لجميع الأسواق
✔ الفوركس
✔ المؤشرات
✔ العملات الرقمية
✔ المعادن
✔ الأسواق الاصطناعية
✔ العقود الآجلة (عبر وكلاء CFD)
قابل للتكيف بدرجة عالية بسبب التحكم في المعلمات مثل:
- كشف التأرجح
- قوة التنعيم
- الحساسية للتغيرات الهيكلية
📈 الإعدادات الموصى بها
- تأرجح اليسار/اليمين: 2–3 للفوركس والمؤشرات، 3–3 للعملات الرقمية
- تنعيم المذبذب: 5–8 لتحقيق توازن في الاستجابة
مصمم للعمل مباشرة، لكنه قابل للتخصيص بالكامل.
💬 انضم إلى مجتمعنا للحصول على أدوات وتحسينات مجانية
انقر على الرابط في ملفي الشخصي للانضمام إلى مجتمع التداول الخاص بنا، حيث ستجد:
- مجموعات معلمات محسنة
- أدوات إضافية
- استراتيجيات قائمة على الهيكل
- موارد حصرية لمؤشرات AlgoTrend
مكان رائع لتطوير نظامك وتحسين الاتساق.
الملخص
Traders use Market Structure Shift for trend confirmation by trading only in the direction of structural momentum, detecting structural reversals via zero-line crossings, and optimizing multi-timeframe workflows (e.g., H4/H1 for trend framework, M30/M15 for entries). It integrates with Market Structure Signals to provide buy/sell arrows, visual shift markers, and structural break alerts, forming a comprehensive structure-based trading system.
The indicator supports multiple markets including Forex, indices, cryptocurrencies, metals, synthetic markets, and futures (via CFDs). It offers customizable parameters for swing detection, smoothing, and sensitivity to structural changes, enabling adaptability across different asset classes and trading styles.
تقييمات العملاء
5 | 0 % | |
4 | 100 % | |
3 | 0 % | |
2 | 0 % | |
1 | 0 % |


