
VegaXLR - Auto Support and Resistance
インジケーター
5 購入済
バージョン 1.0、Feb 2025
Windows、Mac
4.3
レビュー: 3
説明
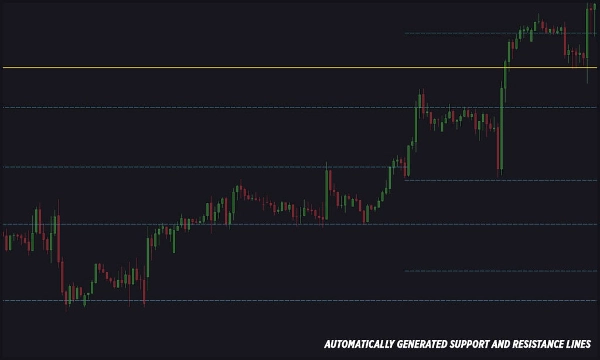
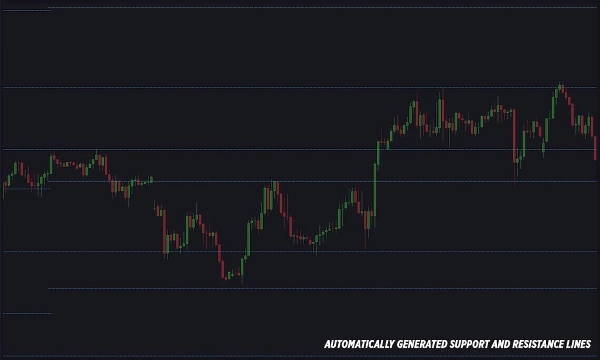
このcTraderインジケーターはチャート上にサポートラインとレジスタンスラインを自動的に描画し、初心者からプロフェッショナルまで使いやすくなっています。ラインは主要なフィボナッチレベルと価格のスイング(ジグザグ)に基づいて生成されます。
特徴:
- サポートラインとレジスタンスラインを自動検出して描画します。
- ラインのスタイル、太さ、色を完全にカスタマイズ可能。
- サポートラインとレジスタンスラインの数を調整可能。
- 価格がサポートまたはレジスタンスラインに接触した際のアラート。
- 複数のアラートオプション:Telegram、メール、ポップアップ、サウンド。
- どのフィボナッチレベルでラインを生成するか選択可能。
- Ask価格またはBid価格のラインからアラートをトリガーするオプション。
- 設定可能なアラート条件:バークローズ時のアラートまたは即時価格接触アラート。
- ユーザー定義のコメント付きカスタマイズ可能なアラートメッセージ。
- 強力なサポートおよびレジスタンスレベルのみにアラートを有効にするオプション。
- チャートのスクリーンショットをキャプチャしてTelegramで送信可能(チャートが表示されている必要があります)。
- 簡単なメールアラート設定。
- チャート上の小さなボタンからユーザーガイドに素早くアクセス可能。
概要
AIによる概要
VegaXLR - Auto Support and Resistance is a cTrader indicator that automatically identifies and draws support and resistance lines on trading charts. It uses key Fibonacci levels combined with price swing analysis (zigzags) to generate these lines, aiding traders in recognizing critical price levels. The indicator offers full customization of line styles, thickness, and colors, and allows adjustment of the number of support and resistance lines displayed.
It features real-time alerts triggered when price interacts with these levels, with configurable conditions such as bar-close or instant price-touch alerts. Alert notifications can be sent via multiple channels including Telegram, Email, pop-ups, and sounds. Users can specify which Fibonacci levels to use for line generation and choose whether alerts trigger from Ask or Bid price lines. Additional options include enabling alerts only for strong levels, customizing alert messages, and capturing chart screenshots to send via Telegram.
A user guide is accessible directly from the chart for ease of use. This tool supports Forex markets and is designed to assist both beginners and professionals in technical analysis by automating the detection of key support and resistance zones.
インジケーターのプロフィール
カスタマーレビュー
4.3
レビュー: 3
5 | 67 % | |
4 | 0 % | |
3 | 33 % | |
2 | 0 % | |
1 | 0 % |
カスタマーレビュー
March 2, 2025
Focused trade layer if the trader wants it keeps attention on levels that actually matter. It works best as support, not a final decision maker. The cleanest use is 3 to 5 levels per chart, with 0.5 pullbacks checked before entry. not every zone holds, even if it looks clean.
March 1, 2025
March 1, 2025
Balanced demo helper for traders who build plans around market levels. It gives value around key price zones, but not every zone holds, even if it looks clean. I would wait for 2 reactions and avoid trades where the target is less than 1.5R. Levels are useful when they reduce noise, not when they crowd the chart.
ディスカッション
よくあるご質問
Forex
cTrader Storeで入手可能な取引ボット、インジケーター、プラグインなどの商品は、第三者の開発者が提供するものであり、情報と技術の取得のみを目的としてご利用いただけます。cTrader Storeはブローカーではなく、投資助言や個人的な推奨を行うことも、将来のパフォーマンスを保証することもありません。
この作成者の他の商品


これも好きかも


価格
215
販売
677
無料インストール