
インジケーターの説明:
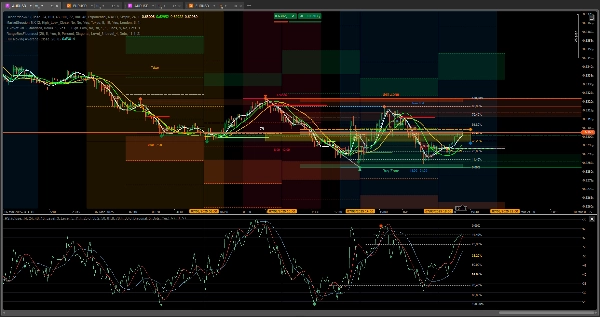
🎯 フィボナッチレベルとハル移動平均を用いたRSIインジケーター 🚀
テクニカル分析を次のレベルに引き上げたいですか?このインジケーターはあなたのためのものです!それは3つの強力なツールのベストを組み合わせています: RSI(相対力指数)、 フィボナッチレベル、そして ハル移動平均 を組み合わせ、市場の包括的かつ正確な見方を提供します。
主な特徴:
- フィボナッチレベルを用いたRSI:
-
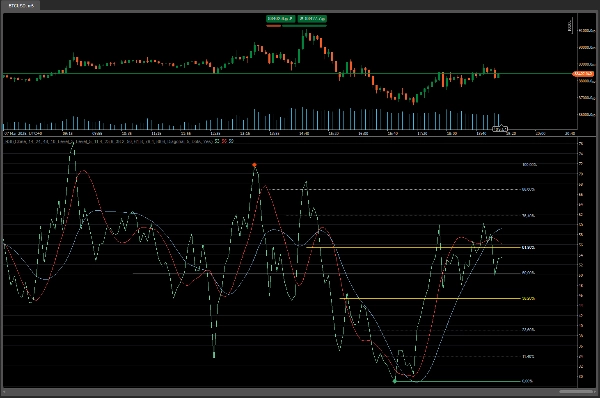
- フィボナッチレベルに基づく重要な サポート および レジスタンス ゾーンを特定します。
- より正確に潜在的な 反転 および 継続 を検出するのに役立ちます。
- ハル移動平均:
-
- 市場のノイズを除去し、トレンドをより効率的に捉えるために2つのハル移動平均(Hull A と Hull B)を含みます。
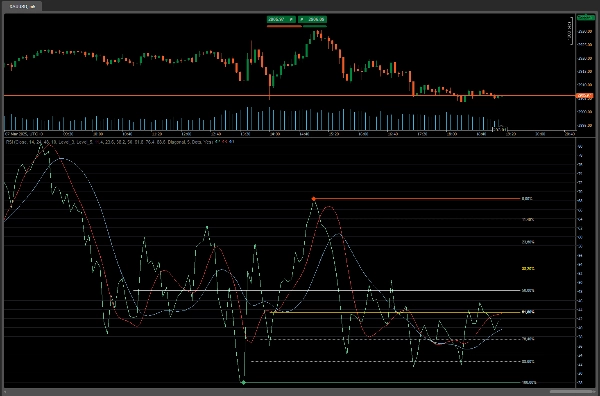
- クロスオーバーや方向変化に基づく明確な エントリー および エグジット シグナルを提供します。
- トレンド変化ゾーン:
-
- トレンド変化が起こりやすい重要なエリアを強調表示し、重要な動きを予測するのに役立ちます。
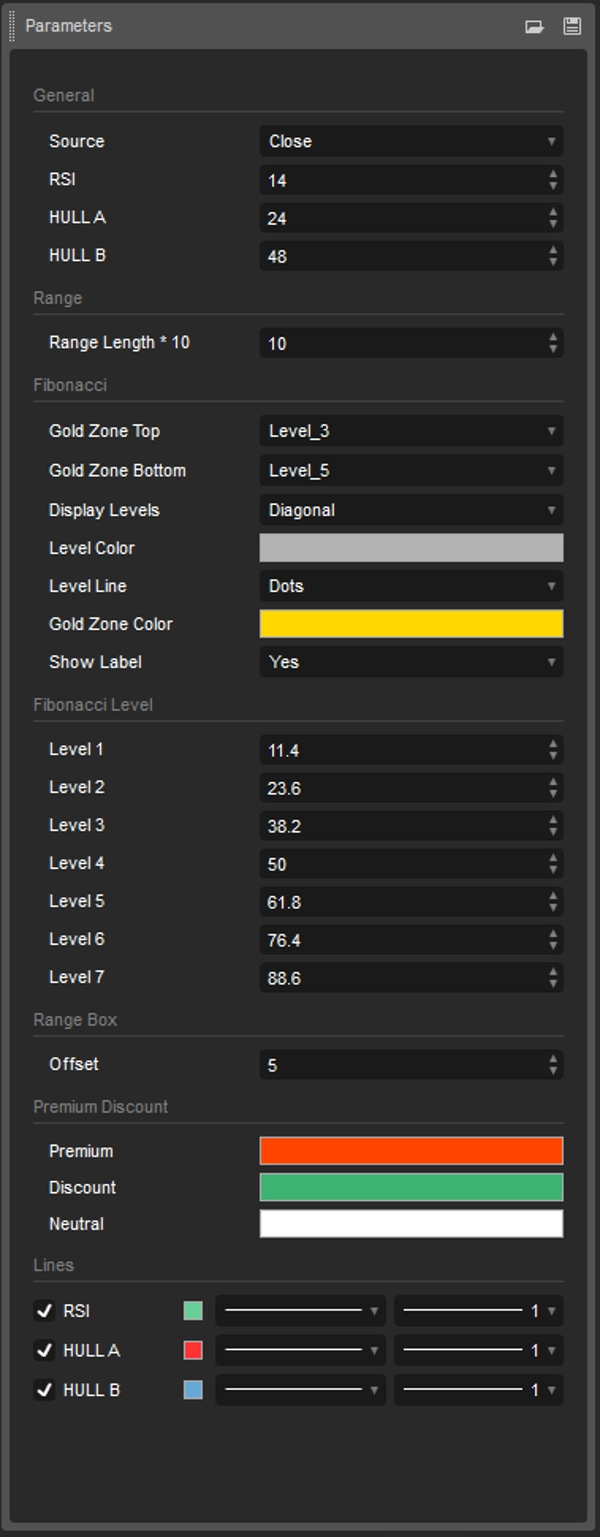
- 完全なカスタマイズ:
-
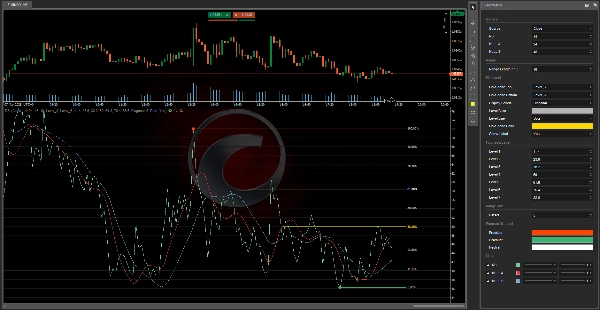
- フィボナッチレベル、色、ラインスタイルを好みに合わせて調整可能。
- ハル移動平均をあなたの取引戦略に合わせて設定できます。
- 明確な視覚化:
-
- 迅速かつ簡単に解釈できる明確なアイコンとトレンドライン。
- フィボナッチレベルをパーセンテージで表示するオプションのラベル。
トレーダーへの利点:
- 高い精度:RSIとフィボナッチレベル、ハル移動平均を組み合わせ、より信頼性の高いシグナルを提供します。
- 時間の節約:複数のインジケーターを重ねる必要がなく、すべてが1つのツールに統合されています。
- 多用途性:任意の時間枠や市場(外国為替、株式、暗号通貨など)で機能します。
- 使いやすさ:初心者から専門家まで、あらゆるレベルのトレーダー向けに設計されています。
なぜこのインジケーターをダウンロードするのか?
- 革新的:他のインジケーターでは見られない、クラシックとモダンなツールのユニークな組み合わせです。
- 効果的:より明確かつ自信を持って取引機会を特定するのに役立ちます。
使い方:
- トレンドを特定する:ハル移動平均を使って市場の方向を判断します。
- RSIシグナルを探す:RSIがフィボナッチレベル付近で買われ過ぎまたは売られ過ぎの状態にあるか確認します。
- フィボナッチで確認する:フィボナッチレベルを使って重要なサポートおよびレジスタンスゾーンを特定します。
- 情報に基づいた判断を下す:明確で正確なシグナルに基づいて自信を持って取引のエントリーやエグジットを行います。
今すぐダウンロードして取引を改善しましょう!
チャートを手動で分析する時間を無駄にしないでください。このインジケーターがあれば、必要なものがすべて一か所に揃っています。取引をより効率的かつ利益的にしましょう!
そして、2つのツールで市場がどう動くかを心配する必要はありません。簡単に一目で買うか売るかがわかり、次の作業に移れます。
RangeBoxFibonacci: https://ctrader.com/products/526?u=VIZAINT
OrderPrice-V3: https://ctrader.com/products/397?u=VIZAINT
そして選択のために
NTMPICLL https://ctrader.com/products/327?u=VIZAINT
MacdVolume https://ctrader.com/products/267?u=VIZAINT
MarketSession-MX: https://ctrader.com/products/525?u=VIZAINT
インジケーターのプロフィール
5.0
レビュー: 1
5 | 100 % | |
4 | 0 % | |
3 | 0 % | |
2 | 0 % | |
1 | 0 % |
カスタマーレビュー
August 28, 2025
FiboTrend-Pro is valuable for traders who rely on Fibonacci-based strategies. It works best on higher TFs
Forex
Indices
Commodities
RSI
Crypto
Stocks
cTrader Storeで入手可能な取引ボット、インジケーター、プラグインなどの商品は、第三者の開発者が提供するものであり、情報と技術の取得のみを目的としてご利用いただけます。cTrader Storeはブローカーではなく、投資助言や個人的な推奨を行うことも、将来のパフォーマンスを保証することもありません。
この作成者の他の商品


![「Gaussian Channel [Iridio Capital]」ロゴ](https://cdn.ctrader.com/image/webp/7c039209-5573-4a54-a072-f9528b503103_41960)


147
販売
11.17K
無料インストール