
Description
Le lissage Jurik comprend 3 étapes :
1ère étape - lissage préliminaire par EMA adaptative : MA1 = (1-alpha)*Price + alpha*MA1[1];
2ème étape - un autre lissage préliminaire par filtre de Kalman : Det0 = (Price - MA1)*(1-beta) + beta*Det0[1]; MA2 = MA1 + PR*Det0;
3ème étape - lissage final par filtre adaptatif unique Jurik : Det1 = (MA2 - JMA[1]) * (1-alpha)^2 + alpha^2 * Det1[1]; JMA = JMA[1] + Det1;
où : - Price - série de prix - alpha - facteur dynamique (sera décrit ci-dessous) - beta - ratio périodique = 0.45*(Length-1)/(0.45*(Length-1)+2) - PR - ratio de phase : PR = Phase/100 + 1.5 (si Phase < -100 alors PR=0.5, si Phase > 100 alors PR=2.5).
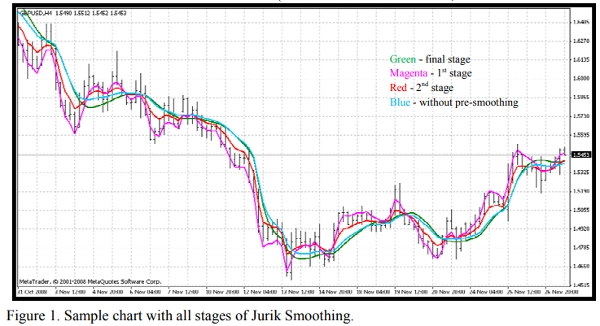
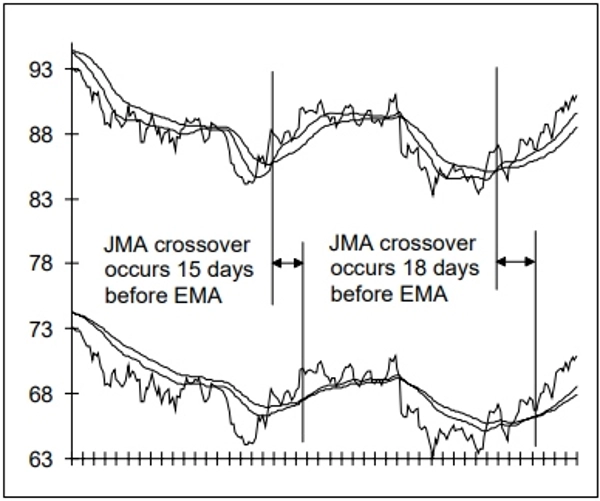
Figure 1. Exemple de graphique avec toutes les étapes du lissage Jurik. Vous pouvez voir les résultats (Figure 1) de chaque étape grâce à l'indicateur joint JurikFilter_v2, en changeant FilterMode : 0 - étape finale (JMA) 1 - 1ère étape 2 - 2ème étape 3 - lissage final uniquement (sans préliminaire).
Le facteur dynamique est un facteur périodique (beta) élevé à une puissance (pow) :
alpha = beta ^ Pow,
où : - pow = rVolty ^ pow1 - rVolty - volatilité relative des prix - pow1 - puissance de la volatilité relative selon la formule suivante : pow1 = len1 - 2 (si pow1 < 0.5 alors pow1 = 0.5),
où len1 - facteur périodique additionnel : len1 = Log(SquareRoot(len))/Log(2.0) + 2 (si len1 < 0 alors len1 = 0).
Ainsi, vous pouvez voir que le facteur dynamique est basé sur la volatilité relative des prix, offrant l'adaptabilité requise pour ce type de filtre de prix.
La formule pour la volatilité relative des prix est rVolty = Volty/AvgVolty (si rVolty > len1^(1/pow1) alors rVolty = len1^(1/pow1), si rVolty < 1 alors rVolty = 1),
où :
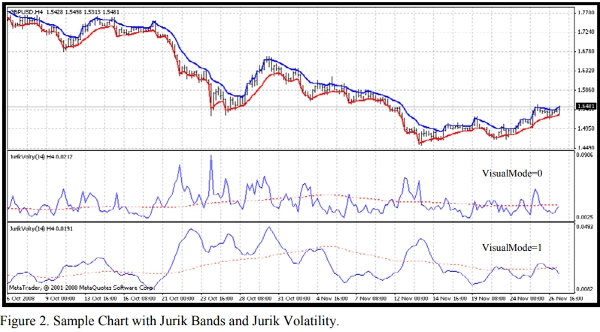
- Volty - volatilité des prix basée sur le calcul des soi-disant Jurik Bands (VisualMode = 1).
- AvgVolty - volatilité moyenne pour laquelle Jurik utilise un algorithme de calcul assez complexe : AvgVolty = Average(vSum,AvgLen),
où :
- vSum - somme incrémentale de (Volty - Volty[10])/10;
- AvgLen - période de la moyenne (Jurik utilise 65).
Dans ma version du filtre Jurik, j'utilise une moyenne simple au lieu de la moyenne complexe de Jurik
De plus, avec l'indicateur joint JurikVolty_v1 (Figure 2), vous pouvez voir les valeurs pour Volty (VisualMode=0), vSum (VisualMode=1) et AvgVolty (ligne rouge pointillée).
La formule pour la volatilité des prix est Volty = max entre Abs(del1) et Abs(del2), si Abs(del1) = Abs(del2) alors Volty = 0,
où : - del1 - distance entre le prix et la bande supérieure del1 = Price - UpperBand - del2 - distance entre le prix et la bande inférieure del2 = Price - LowerBand Les Jurik Bands sont différents de toutes les bandes de prix connues telles que Bollinger, Keltner, Donchian, Fractal, etc. : si del1 > 0 alors UpperBand = Price sinon UpperBand = Price - Kv*del1 si del2 < 0 alors LowerBand = Price sinon LowerBand = Price - Kv*del2,
où : - Kv - facteur de volatilité Kv = bet ^ SquareRoot(pow2). Il est facile de voir que ces bandes peuvent servir de base à un indicateur de suivi de tendance comme le Parabolique de Wilder. Ainsi, vous pouvez constater que nous n'avons pratiquement pas de zones obscures dans l'algorithme de la moyenne mobile Jurik (JMA)
Résumé
Avis clients
5 | 0 % | |
4 | 100 % | |
3 | 0 % | |
2 | 0 % | |
1 | 0 % |


![Logo de "High-Low Divergence [Iridio Capital]"](https://cdn.ctrader.com/image/webp/443c4661-7abb-40f1-842f-4b6ec560649b_40914)


