
Sero
Wskaźnik
105 pobrania
Wersja 1.0, Mar 2026
Windows, Mac
Opis
Sero — Oscylator Momentum
Sero to oscylator momentum oparty na stochastyce, który daje wyraźne, kolorowe sygnały wizualne dotyczące zmian momentum na rynku.
Jak to działa
Sero oblicza wygładzoną wartość stochastyczną z Typowej Ceny (High+Low+Close)/3 w zakresie 15 świec, a następnie stosuje szybkie 2-okresowe EMA, aby uzyskać responsywny oscylator 0–100.
Na co zwracać uwagę
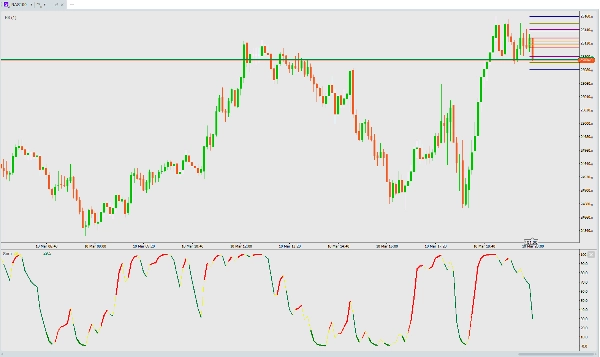
Kolory mówią wszystko:
- Żółta linia — podstawowa wartość Sero (zawsze widoczna)
- Czerwona linia — momentum bycze (Sero rośnie)
- Gruba czerwona linia — silne bycze momentum (rosnące + powyżej 20 — potwierdzenie wybicia z wyprzedania)
- Zielona linia — momentum niedźwiedzie (Sero spada)
- Gruba zielona linia — silny spadek niedźwiedzi (spadające + poniżej 20 — głęboko w strefie wyprzedania)
Kluczowe sygnały:
- Sygnał kupna — zmiana koloru z zielonego na czerwony, szczególnie z poziomu poniżej 20 (odwrócenie z wyprzedania)
- Sygnał sprzedaży — zmiana koloru z czerwonego na zielony, szczególnie z poziomu powyżej 80 (odwrócenie z wykupienia)
- Silny trend — grube linie potwierdzają siłę momentum
- Wyczerpanie — gruba zielona linia poniżej 20 = sprzedający mogą tracić impet, obserwuj odwrócenie
Najlepsze praktyki
- Działa na dowolnym interwale czasowym i dowolnym instrumencie
- Łącz z analizą cenową lub poziomami wsparcia/oporu dla potwierdzenia
- Przejścia kolorów w pobliżu ekstremów (0 lub 100) to sygnały o najwyższym prawdopodobieństwie
- Brak potrzeby ustawień — zoptymalizowany i gotowy do użycia od razu
Podsumowanie
Podsumowanie AI
Sero is a stochastic-based momentum oscillator designed to identify market momentum shifts through clear, color-coded visual signals. It calculates a smoothed stochastic value from the Typical Price [(High + Low + Close) / 3] over a 15-bar range, then applies a fast 2-period exponential moving average (EMA) to generate a responsive oscillator ranging from 0 to 100.
The indicator displays multiple colored lines to represent momentum states:
- Yellow line: base Sero value (always visible)
- Red line: bullish momentum (rising oscillator)
- Thick red line: strong bullish momentum (rising and above 20, indicating breakout from oversold)
- Green line: bearish momentum (falling oscillator)
- Thick green line: strong bearish momentum (falling and below 20, indicating deep oversold conditions)
Key signals include buy signals when the color flips from green to red, especially below 20 (oversold reversal), and sell signals when it flips from red to green, especially above 80 (overbought reversal). Thick lines confirm strong momentum trends, while thick green lines below 20 may indicate exhaustion of selling pressure and potential reversal.
Sero works on any timeframe and instrument without requiring user settings, and it is recommended to combine it with price action or support/resistance levels for confirmation. Color transitions near extremes (0 or 100) provide the highest-probability signals.
Profil wskaźnika
Opinie klientów
0.0
Opinie: 0
Opinie klientów
Ten produkt nie ma jeszcze opinii. Wypróbowałeś(-aś) go już? Bądź pierwszy(-a) i powiedz o tym innym!
Dyskusja
Częste pytania
BTCUSD
Forex
Signal
Indices
EURUSD
Commodities
GBPUSD
NZDUSD
Crypto
Stocks
XAUUSD
NAS100
USDJPY
Produkty dostępne za pośrednictwem cTrader Store, w tym boty handlowe, wskaźniki i wtyczki, dostarczane są przez deweloperów zewnętrznych i udostępniane wyłącznie w celach informacyjnych oraz w celu zapewnienia dostępu technicznego. cTrader Store nie jest brokerem i nie zapewnia doradztwa inwestycyjnego, nie udziela spersonalizowanych rekomendacji ani nie gwarantuje przyszłych wyników.
Więcej od tego autora


Cena
Od 10/03/2026
105
Bezpłatne instalacje