
Opis
Odblokuj potężną strukturę rynku dzięki temu czystemu i konfigurowalnemu narzędziu Opening Range Breakout.
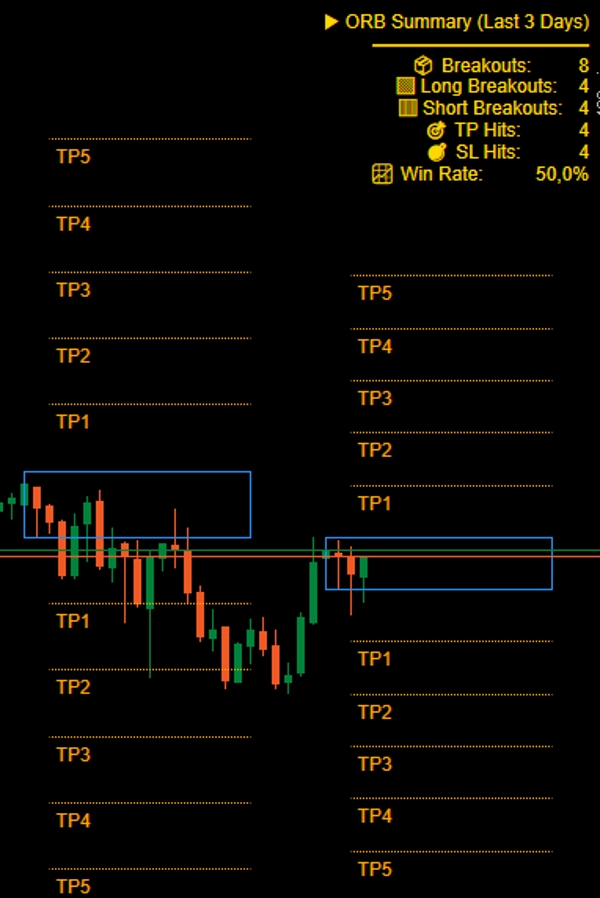
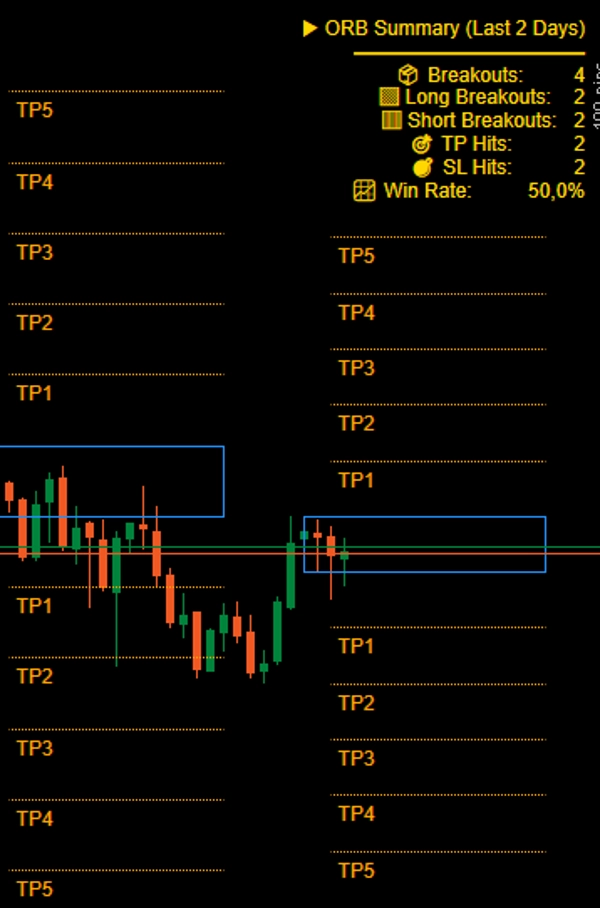
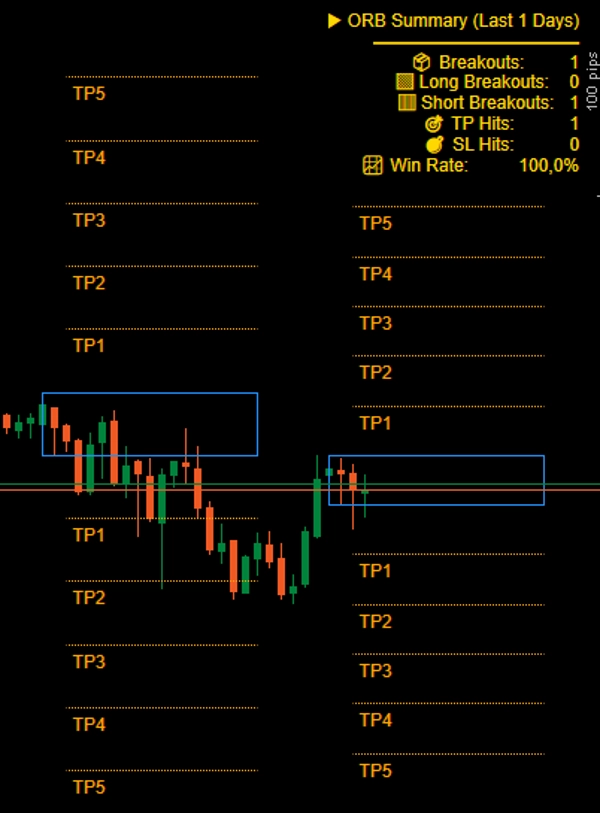
Śledź wysoce prawdopodobne wybicia z aktualnymi statystykami! Dynamiczne śledzenie TP/SL oraz przejrzysty panel statystyk do monitorowania wskaźnika wygranych i wyników wybicia/
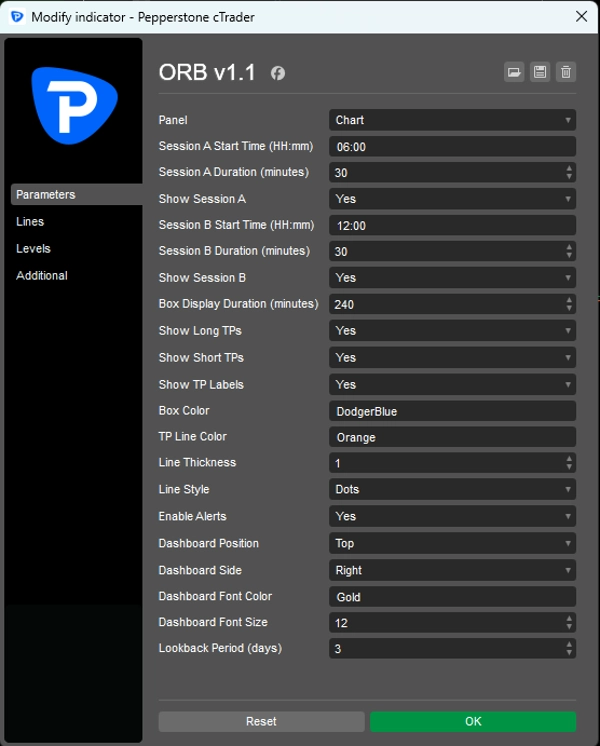
Rysuje pudełka wybicia dla dwóch sesji z opcjonalnymi poziomami take-profit. Idealne dla traderów korzystających z ORB lub ustawień opartych na zmienności.
🕐 Definiuj niestandardowe czasy sesji
📦 Wyświetlaj czyste pudełka wybicia
🎯 Pokaż poziomy TP (1R–5R) z opcjami stylizacji
🎨 W pełni konfigurowalne kolory, etykiety, style linii
🧭 Proste, szybkie i bez bałaganu – dokładnie to, czego potrzebujesz
Idealne do ręcznego wykonywania strategii lub łączenia z własną logiką.
Idealne dla traderów, którzy chcą precyzji i wydajności w jednym narzędziu.
Podsumowanie
Opinie klientów
5 | 0 % | |
4 | 100 % | |
3 | 0 % | |
2 | 0 % | |
1 | 0 % |


![Logo „[Hamster-Coder] Moving Average MTF”](https://cdn.ctrader.com/image/webp/b11b98b1-194d-4b8e-b00e-d611826ad159_31226)


