
Keylevels v1.1
Wskaźnik
1 zakupy
Wersja 1.0, Nov 2025
Windows, Mac
5.0
Opinie: 1
Opis
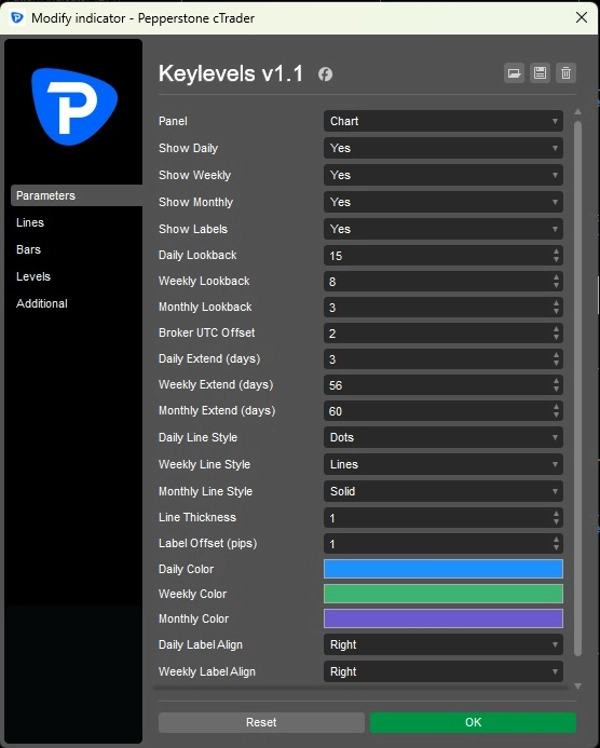
Wskaźnik Key Levels Indicator to precyzyjne narzędzie zaprojektowane dla profesjonalnych traderów, którzy wymagają jasności, dyscypliny i kontroli w swoim workflow. Zbudowany z rygorystyczną logiką cofania i obsługą przesunięcia UTC brokera, zapewnia, że dzienne, tygodniowe i miesięczne maksima i minima są wykreślane dokładnie tak, jak śledzą je instytucjonalne biura.
Kluczowe cechy obejmują:
- Kontrola przesunięcia UTC brokera dla dokładnego dopasowania sesji na różnych serwerach.
- Oddzielne style linii dla każdego poziomu (Dzienny, Tygodniowy, Miesięczny) dla wyraźnego rozróżnienia wizualnego.
- Niestandardowe wyrównanie etykiet (Lewo, Centrum, Prawo) aby zapobiec nakładaniu się i utrzymać czytelność wykresu.
- Ścisłe egzekwowanie cofania z czystym usuwaniem przestarzałych poziomów.
- Minimalistyczny, pozbawiony bałaganu design z konfigurowalnymi kolorami, grubością i przesunięciami etykiet.
Ten wskaźnik został zaprojektowany z myślą o szybkości, dokładności i klarowności workflow. Niezależnie od tego, czy mapujesz poziomy instytucjonalne, czy udoskonalasz własny proces techniczny, dostarcza solidne, konfigurowalne rozwiązanie, które utrzymuje Twoje wykresy czyste, a podejmowanie decyzji precyzyjne.
Podsumowanie
Profil wskaźnika
Opinie klientów
5.0
Opinie: 1
5 | 100 % | |
4 | 0 % | |
3 | 0 % | |
2 | 0 % | |
1 | 0 % |
Dyskusja
Częste pytania
Forex
Signal
Breakout
Indices
EURUSD
Commodities
GBPUSD
NZDUSD
Prop
Scalping
SMC
Stocks
AI
XAUUSD
NAS100
USDJPY
Produkty dostępne za pośrednictwem cTrader Store, w tym boty handlowe, wskaźniki i wtyczki, dostarczane są przez deweloperów zewnętrznych i udostępniane wyłącznie w celach informacyjnych oraz w celu zapewnienia dostępu technicznego. cTrader Store nie jest brokerem i nie zapewnia doradztwa inwestycyjnego, nie udziela spersonalizowanych rekomendacji ani nie gwarantuje przyszłych wyników.
Więcej od tego autora


Cena
Od 24/04/2025
169.78M
Wolumen transakcji
17.75K
Zysk w pipsach
11
Sprzedaż
328
Bezpłatne instalacje