
Opis
QX FrameForge to nakładka wielookresowego panelu stanu rynku dla cTrader. Kompresuje to, co dzieje się na kilku ramach czasowych, w szybki, czytelny panel, dzięki czemu możesz handlować z kontekstem zamiast zgadywać.
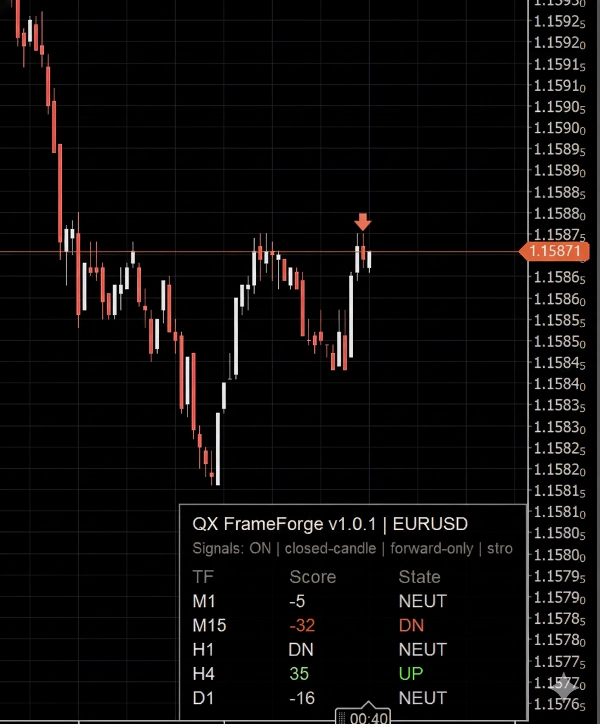
Dla każdej wybranej ramy czasowej panel pokazuje:
- TF (ramę czasową)
- Wynik (-100 do +100) wyrażający kierunek i siłę
- Stan: W GÓRĘ / NEUT / W DÓŁ dla szybkich decyzji
Opcjonalne strzałki można włączyć, aby oznaczyć potwierdzenia używając tylko zamkniętych świec, co utrzymuje wykres stabilny i unika migotania wewnątrz świecy.
Jak to czytać (przyjazne dla początkujących)
Pomyśl o panelu jak o mierniku kierunku:
- Pozytywny wynik i W GÓRĘ oznacza bycze warunki na tej ramie czasowej
- Negatywny wynik i W DÓŁ oznacza niedźwiedzie warunki na tej ramie czasowej
- NEUT oznacza, że warunki są mieszane, boczne lub niewystarczająco silne, by być kierunkowe
Ustawienie Strefy Neutralnej kontroluje, jak łatwo wskaźnik przełącza się na NEUT. Szersza strefa neutralna generuje mniej stanów kierunkowych (bardziej konserwatywne).
Co jest w Wyniku (na wysokim poziomie)
Wynik łączy:
- komponent trendowy (kierunek i zachowanie nachylenia)
- komponent momentum (siła kontynuacji vs wahanie)
- opcjonalny filtr zmienności aby ograniczyć hałaśliwe okresy
Wynikiem jest ograniczony wynik zaprojektowany do wielookresowego wyrównania, a nie do „magicznych wejść”.
Jak traderzy zazwyczaj używają FrameForge
1) Wielookresowe wyrównanie
- Preferuj transakcje, gdy wyższe ramy czasowe się zgadzają (przykład: H1 + H4 oba W GÓRĘ)
- Użyj niższej ramy czasowej (przykład: M5) do określenia momentu wejścia
2) Filtrowanie reżimu
- Zbyt wiele NEUT zwykle oznacza ruch boczny i niższą jakość warunków
- Mieszany kierunek wyższych TF sugeruje ostrożność lub mniejszą ekspozycję
3) Warstwa potwierdzenia
- Użyj FrameForge, aby potwierdzić, że twoja konfiguracja jest zgodna, zanim się zaangażujesz
Opcjonalne strzałki (sygnały)
Strzałki są opcjonalnym wizualnym pomocnikiem. Są oceniane tylko na ostatniej zamkniętej świecy.
Możesz wybrać, jak strzałki są wyzwalane:
- tylko gdy siła przekracza próg,
- tylko gdy zmienia się stan kierunkowy,
- lub częściej, gdy warunki pozostają silne.
Sterowanie obejmuje:
- próg siły
- czas odnowienia (minimalna liczba świec między strzałkami)
- jeden sygnał na wahnięcie (redukuje powtarzające się strzałki w tym samym kierunku)
- limit ikon (zapobiega zaśmiecaniu wykresu)
Ważne: strzałki są zaprojektowane jako tylko do przodu od momentu ich włączenia, aby uniknąć spamu historycznych obiektów i mylących wizualizacji retrospektywnych.
Kompatybilność
- Działa na dowolnym symbolu cTrader i dowolnej ramie czasowej wykresu
- Tylko wskaźnik. Nie są składane żadne zlecenia.
- Zoptymalizowane aktualizacje UI, aby utrzymać responsywność wykresów.
Zrzeczenie się odpowiedzialności za ryzyko
Handel wiąże się z ryzykiem. Wyniki z przeszłości nie gwarantują przyszłych rezultatów.
Podsumowanie
The Score integrates trend direction and slope, momentum strength, and an optional volatility filter to reduce noise, producing a bounded metric aimed at multi-timeframe alignment rather than precise entry signals. Traders typically use FrameForge for aligning trades across timeframes (e.g., confirming higher timeframe trends before timing entries on lower timeframes), filtering market regimes by identifying choppy or mixed conditions, and adding a confirmation layer to their setups.
Arrow signals can be customized by strength thresholds, directional changes, cooldown periods, and icon limits to avoid chart clutter. The indicator works on any cTrader symbol and timeframe, updating efficiently to maintain chart responsiveness. It does not place orders and serves solely as a visual analytical tool.
Opinie klientów
5 | 100 % | |
4 | 0 % | |
3 | 0 % | |
2 | 0 % | |
1 | 0 % |


