
Opis
QX PivotZones to wskaźnik Pivot Points stworzony do prawdziwych decyzji handlowych, a nie tylko statycznych linii, które cena ignoruje"
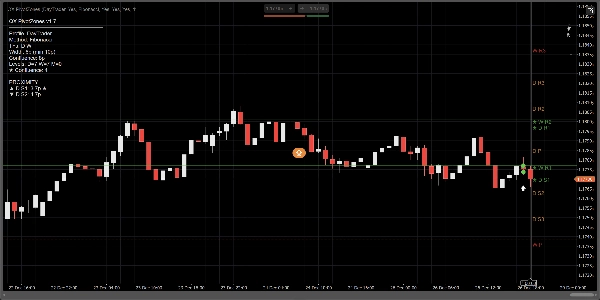
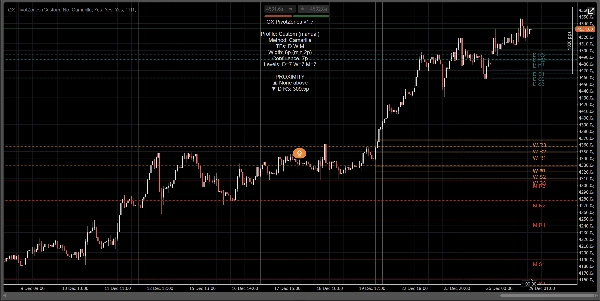
Oblicza dzienne, tygodniowe i miesięczne pivoty za pomocą klasycznych, Fibonacciego, Camarilli lub Woodiego i wyświetla je jako prawdziwe strefy cenowe (pasy) o regulowanej szerokości (pipsy lub oparte na ATR). Główna zaleta jest prosta: automatycznie podkreśla wieloczasową konfluencję i zamienia pivoty w obszary do działania, a nie „fantazje o idealnych liniach”.
Dlaczego różni się od typowych narzędzi Fibonacci Pivot / FiboPoints:
Większość wskaźników „FiboPoints” zatrzymuje się na podstawowych liniach pivot. QX PivotZones dodaje to, czego traderzy naprawdę potrzebują:
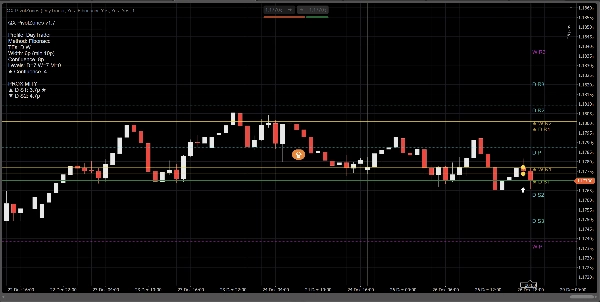
- Automatyczne wykrywanie konfluencji D/W/M: gdy pivoty z różnych ram czasowych się skupiają, poziom jest podświetlany (★) i malowany kolorem konfluencji.
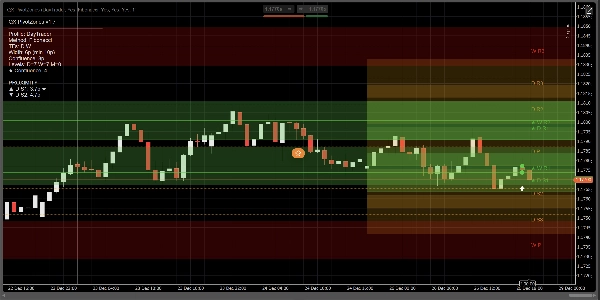
- Strefy (pasy) zamiast cienkich linii: definiuj szerokość w pipsach lub ATR. To redukuje szumy wynikające z reakcji „prawie dotknięcia”.
- Filtr najbliższych poziomów (opcjonalny): pokazuje tylko najbardziej istotne strefy powyżej i poniżej aktualnej ceny.
- Przydatne alerty: wyzwalane przy wejściu do strefy, dotknięciu linii lub obu, z czasem odnowienia i opcjonalnym filtrem „tylko konfluencja”.
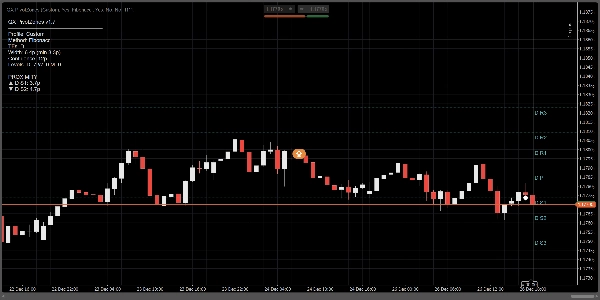
- Panel informacyjny + bliskość: zobacz włączone ramy czasowe, metodę, szerokość strefy, liczbę konfluencji i odległość do najbliższej strefy powyżej/poniżej.
Jak używać:
1) Wybierz profil
- Scalper: intraday, mniej poziomów, węższe adaptacyjne strefy.
- DayTrader: dzienne + tygodniowe (domyślnie).
- Swing: dzienne + tygodniowe + miesięczne.
- Niestandardowy: ręczna kontrola wszystkiego.
Wskazówka: jeśli chcesz „DayTrader + Monthly”, wyłącz nadpisania profilu (lub użyj Niestandardowego) i włącz Pokaż miesięczne ręcznie.
2) Skonfiguruj strefy (cały sens)
Pod Tryb szerokości strefy:
- Pipsy dla stałych, spójnych pasów.
- ATR dla pasów adaptujących się do zmienności.
Kluczowe parametry:
- Szerokość strefy (pipsy) lub współczynnik ATR k
- Minimalna szerokość strefy (pipsy) aby zapobiec zbyt cienkim pasom
- Wypełnienie stref do malowania stref
- Rozszerz strefy w prawo aby projektować pasy na widocznej prawej stronie
3) Włącz konfluencję (główna cecha wyróżniająca)
- Podświetl konfluencję: WŁ.
- Tryb konfluencji:
-
- Pipsy dla stałej tolerancji
- ATR dla adaptacyjnej tolerancji
- Odległość konfluencji lub współczynnik ATR konfluencji k
Poziomy konfluencji otrzymują:
- Kolor konfluencji
- ★ znacznik na etykiecie
- Liczba wyświetlana na panelu
4) Alerty (handluj bez wpatrywania się w ekran)
- Alerty: wejście do strefy, dotknięcie linii lub oba
- Alerty: tylko konfluencja: redukuje szumy
- Czas odnowienia alertu (świece): zapobiega spamowi
- Wyświetl ikony alertów: oznacza zdarzenia na wykresie
Szybkie ustawienia wstępne (zalecane)
Scalping (M5–M15)
- Tryb szerokości strefy: ATR
- Współczynnik ATR k: 0.15–0.25
- Tryb konfluencji: Pipsy
- Odległość konfluencji: 4–8 pipsów
- Tylko najbliższe strefy: WŁ. (3 powyżej / 3 poniżej)
Day Trading (M15–H1)
- Tryb szerokości strefy: Pipsy
- Szerokość: 6–10 pipsów
- Konfluencja: 8–12 pipsów
- Włącz Dzienny + Tygodniowy
Swing (H4–D1)
- Tryb szerokości strefy: ATR
- Współczynnik ATR k: 0.25–0.45
- Włącz Dzienny + Tygodniowy + Miesięczny
Co robi (a czego nie robi)
- To nie generator sygnałów kupna/sprzedaży.
- To jest mapa struktury rynku / stref wsparcia i oporu z alertami zdarzeń (wejście/dotknięcie) i podświetleniem konfluencji.
- Najlepsze zastosowania: reakcje na pivotach, odrzucenie/akceptacja, cofnięcia, cele, skalowanie wyjścia i ochrona transakcji.
Podsumowanie
Opinie klientów
5 | 100 % | |
4 | 0 % | |
3 | 0 % | |
2 | 0 % | |
1 | 0 % |


