
QX MatrixHybrid
Wskaźnik
Wersja 1.0, Feb 2026
Windows, Mac
4.6
Opinie: 3
Opis
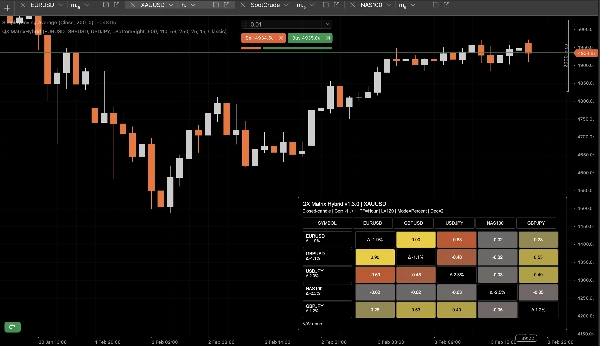
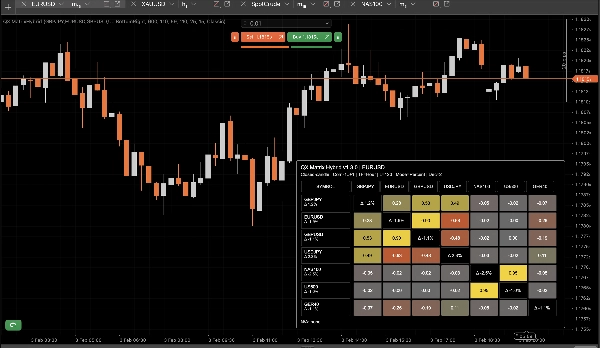
QX Matrix Hybrid jest wizualnym wskaźnikiem pokazującym macierz korelacji wieloekonomicznych aktywów jako czysty panel heatmapy. Pomaga natychmiast zidentyfikować, które instrumenty poruszają się razem, które poruszają się odwrotnie oraz gdzie możesz nieumyślnie powielać ekspozycję na różnych rynkach.
Kluczowe cechy
- Macierz korelacji (-1 do +1) z wykorzystaniem korelacji Pearsona między symbolami.
- Tryb zwrotu:
-
- Zwroty procentowe
- Zwroty logarytmiczne
- Siła (Δ%) na symbol: pokazuje wyniki każdego symbolu w oknie analizy (w etykietach wierszy i opcjonalnie na przekątnej).
- Automatyczny kontrast tekstu: kolor tekstu dostosowuje się do luminancji tła dla czytelności.
- Motywy + niestandardowa paleta: wiele presetów oraz pełna kontrola wyboru kolorów.
- Elastyczny układ panelu: dokowanie w rogu, szerokość, rozmiar komórek, marginesy, kontrola wysokości wierszy.
- Inteligentny stopka: lista brakujących/niedostępnych symboli z konfigurowalnym skracaniem.
Wydajność i logika aktualizacji
Zaprojektowany, aby pozostać responsywnym nawet przy wielu symbolach:
- Buforowanie na symbol obiektów Symbol i Bars, aby uniknąć powtarzających się wywołań API.
- Automatyczne unieważnianie bufora gdy Symbols CSV lub TimeFrame ulegają zmianie.
- Tryb tylko zamkniętej świecy minimalizujący obciążenie CPU (aktualizacje przy nowych zamkniętych słupkach).
- Opcjonalny Throttle aktualizacji (ms) dla trybu na żywo.
Jak go używać
- +1.00: silny pozytywny współruch (wysoka redundancja).
- 0.00: słaby związek (potencjalna dywersyfikacja).
- -1.00: silna odwrotna zależność (możliwa zabezpieczenie).
Użyj macierzy, aby zmniejszyć skorelowane nakładanie się, znaleźć pary zabezpieczające i zrozumieć „klastry” rynkowe na rynku FX, indeksów, metali, kryptowalut itp.
Parametry (wysoki poziom)
- Symbols CSV, TimeFrame, Lookback
- Tryb zwrotu (Procent/Log), Miejsca dziesiętne, Automatyczne miejsca dziesiętne przy Log
- Tryb tylko zamkniętej świecy, Throttle aktualizacji
- Pokaż siłę (Δ%), Pokaż stopkę, Maksymalna liczba brakujących w stopce
- Układ panelu (róg, szerokość, rozmiary komórek, margines)
- Kolory / motyw (w tym niestandardowa paleta)
Uwagi
- Tylko wizualizacja. Nie są składane żadne zlecenia.
- Symbole mogą wyświetlać N/A jeśli nie są dostępne u twojego brokera/serwera lub jeśli nie ma wystarczającej historii dla wybranego interwału/czasu analizy.
Podsumowanie
Profil wskaźnika
Opinie klientów
4.6
Opinie: 3
5 | 67 % | |
4 | 33 % | |
3 | 0 % | |
2 | 0 % | |
1 | 0 % |
Opinie klientów
February 12, 2026
The part that matters is bad ideas get easier to avoid, and 20 signals is a fair first sample.
February 9, 2026
Two sessions say more than one clean chart, and weak ideas are easier to skip.
February 5, 2026
Ngl, weak ideas are easier to skip and that is enough to keep testing it. Price action still has to agree.
Dyskusja
Częste pytania
Signal
Indices
Commodities
GBPUSD
RSI
Bollinger
Fibonacci
Scalping
AI
XAUUSD
NAS100
MACD
BTCUSD
Forex
Breakout
EURUSD
NZDUSD
Martingale
Prop
ZigZag
Supertrend
Fair Value Gap
SMC
Crypto
Grid
Stocks
ATR
USDJPY
VWAP
Produkty dostępne za pośrednictwem cTrader Store, w tym boty handlowe, wskaźniki i wtyczki, dostarczane są przez deweloperów zewnętrznych i udostępniane wyłącznie w celach informacyjnych oraz w celu zapewnienia dostępu technicznego. cTrader Store nie jest brokerem i nie zapewnia doradztwa inwestycyjnego, nie udziela spersonalizowanych rekomendacji ani nie gwarantuje przyszłych wyników.


Cena
41.97M
Wolumen transakcji
208.53K
Zysk w pipsach
13
Sprzedaż
344
Bezpłatne instalacje