
Inside Candle
Wskaźnik
1 zakupy
Wersja 1.0, Oct 2025
Windows, Mac
5.0
Opinie: 2
Od 11/10/2025
2.55M
Wolumen transakcji
17.52K
Zysk w pipsach
1
Sprzedaż
231
Bezpłatne instalacje
Opis
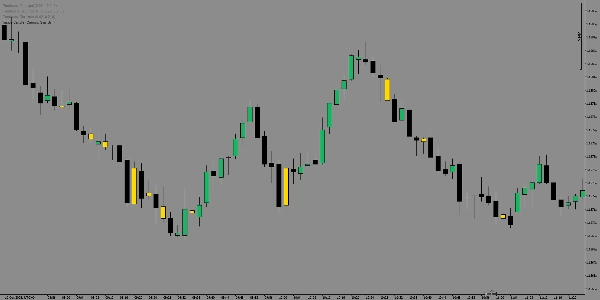
Precyzyjnie identyfikuj potężne strefy wybicia i konsolidacje rynku za pomocą Wskaźnika Świecy Wewnętrznej.
To narzędzie podkreśla każdy wzór świecy wewnętrznej — momenty, gdy zmienność się kurczy, a rynek przygotowuje się do gwałtownego ruchu.
Wykrywając, kiedy maksimum i minimum świecy są całkowicie zawarte w poprzedniej, wizualnie zaznacza obszary akumulacji lub niezdecydowania, pomagając przewidzieć potencjalne punkty wybicia zanim się wydarzą.
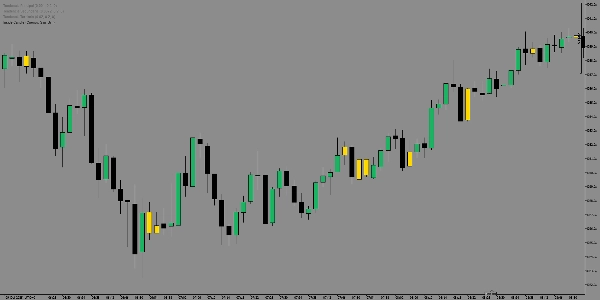
Użyj go do:
- Wykrywania kontynuacji trendu oraz wczesnych odwróceń.
- Filtrowania transakcji według stref kompresji zmienności.
- Natychmiastowego rozpoznawania, kiedy rynek „ładuje energię” na kolejny ruch.
Czysty, dokładny i wizualnie intuicyjny — Wskaźnik Świecy Wewnętrznej zamienia złożoną strukturę rynku w proste wizualne wskazówki.
Podsumowanie
Podsumowanie AI
The Inside Candle indicator identifies Inside Bar patterns by detecting when a candle’s high and low are fully contained within the previous candle. This highlights zones of market consolidation and volatility contraction, signaling potential breakout points. It visually marks areas of accumulation or indecision, helping traders anticipate trend continuations or early reversals. The indicator supports markets including Forex, commodities, indices, and symbols such as EURUSD, GBPUSD, USDJPY, BTCUSD, XAUUSD, and NAS100. Key features include filtering trades by volatility compression zones and providing clear, intuitive visual cues to recognize when the market is preparing for significant moves. This tool is designed to simplify complex market structures into actionable insights for breakout and trend-following strategies.
Profil wskaźnika
Opinie klientów
5.0
Opinie: 2
5 | 100 % | |
4 | 0 % | |
3 | 0 % | |
2 | 0 % | |
1 | 0 % |
Opinie klientów
October 22, 2025
October 21, 2025
The better read comes from the process slows down in a good way. It should stay in the support stack.
Dyskusja
Częste pytania
BTCUSD
Forex
Signal
Breakout
Indices
EURUSD
Commodities
GBPUSD
NZDUSD
RSI
Fibonacci
Scalping
XAUUSD
NAS100
ATR
MACD
USDJPY
VWAP
Produkty dostępne za pośrednictwem cTrader Store, w tym boty handlowe, wskaźniki i wtyczki, dostarczane są przez deweloperów zewnętrznych i udostępniane wyłącznie w celach informacyjnych oraz w celu zapewnienia dostępu technicznego. cTrader Store nie jest brokerem i nie zapewnia doradztwa inwestycyjnego, nie udziela spersonalizowanych rekomendacji ani nie gwarantuje przyszłych wyników.
Więcej od tego autora


Cena
Od 11/10/2025
2.55M
Wolumen transakcji
17.52K
Zysk w pipsach
1
Sprzedaż
231
Bezpłatne instalacje