
MultiTF-Pivot_SR
Indikator
2 pembelian
Versi 1.0, May 2025
Windows, Mac
4.5
Ulasan: 2
Sejak 29/05/2025
3.04M
Volum yang didagangkan
45.22K
Pip dimenangi
29
Jualan
775
Pemasangan percuma
Penerangan
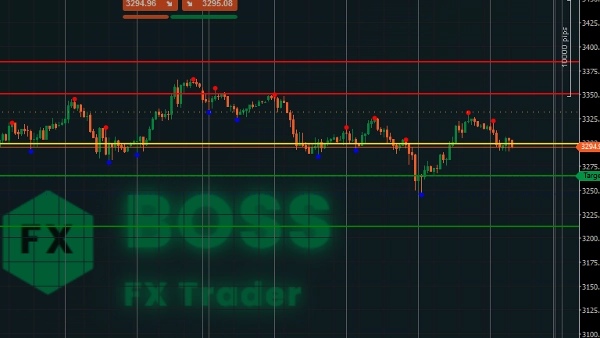
MultiTF_Pivot_SR V2 - Penunjuk Gabungan Sokongan & Rintangan + Titik Pivot untuk cTrader yang berfungsi pada mana-mana jangka masa.
Mengapa penunjuk ini berguna dalam perdagangan?
✅ Ciri-ciri:
Versi 2 Dikeluarkan.
Penambahbaikan ditambah untuk Penunjuk ini.
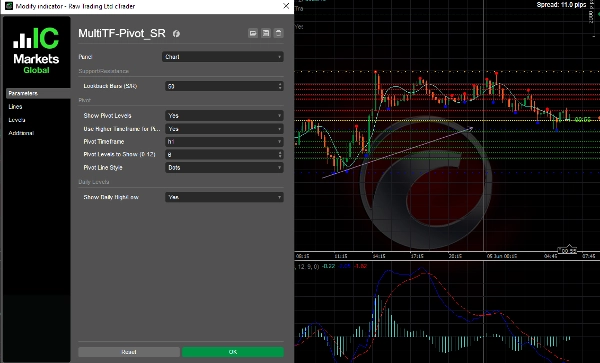
- Mengesan Tinggi dan Rendah Harian secara Automatik (Pilihan Parameter tersedia Y/T).
- Tahap Pivot untuk dipaparkan (boleh dikonfigurasikan sehingga 12 pengiraan berdasarkan).
- Memaparkan garis dalam Gaya (boleh dikonfigurasikan mengikut keutamaan anda).
- Sokongan dan Rintangan Bar Lookback (default 50 adalah baik berdasarkan pengiraan dan boleh dikonfigurasikan mengikut keutamaan anda).
- Lukisan pada carta tidak disekat.
Versi Sebelumnya 1 Dikeluarkan.
- Mengira titik pivot (Standard) dari tempoh sebelumnya.
- Mengesan zon sokongan dan rintangan berdasarkan tinggi/rendah ayunan terkini.
- Menyesuaikan kepada mana-mana jangka masa (boleh dikonfigurasikan).
- Memaparkan garis dan label untuk tahap pivot, sokongan, dan rintangan.
Ringkasan
Ringkasan AI
MultiTF-Pivot_SR V2 is a combined support and resistance plus pivot point indicator designed for the cTrader platform. It operates on any time frame, adapting to user preferences. The indicator automatically detects daily high and low levels, with configurable options to enable or disable this feature. It calculates up to 12 pivot levels based on the previous period’s data and identifies support and resistance zones derived from recent swing highs and lows. Users can customize the display style of lines and labels for pivot, support, and resistance levels. The indicator supports lookback bars for determining support and resistance, with a default setting of 50 bars that can be adjusted. Chart drawings remain unobstructed when using this tool. This version includes upgrades from the previous release, enhancing functionality and configurability for traders seeking to analyze key price levels efficiently.
Profil indikator
Ulasan pelanggan
4.5
Ulasan: 2
5 | 50 % | |
4 | 50 % | |
3 | 0 % | |
2 | 0 % | |
1 | 0 % |
Ulasan pelanggan
June 5, 2025
June 3, 2025
The first thing that worked was the entry feels less rushed, and a small account test feels safer.
Perbincangan
Soalan Lazim
Produk yang tersedia melalui cTrader Store, termasuk bot dagangan, indikator dan plugin, disediakan oleh pembangun pihak ketiga dan diberikan akses untuk tujuan maklumat dan teknikal sahaja. cTrader Store bukan broker dan tidak memberikan nasihat pelaburan, syor peribadi atau sebarang jaminan prestasi masa hadapan.


Harga
Sejak 29/05/2025
3.04M
Volum yang didagangkan
45.22K
Pip dimenangi
29
Jualan
775
Pemasangan percuma