Penerangan
🚀 Penunjuk TMAX RBA - Sistem Momentum Multi-Jangka Masa Terunggul 🚀
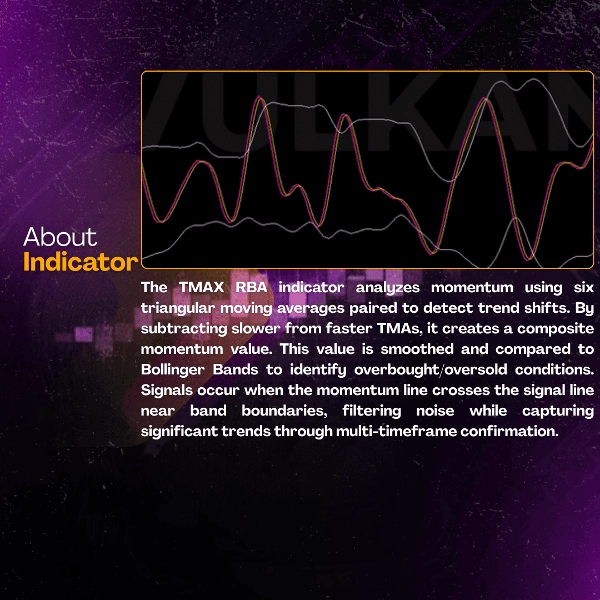
📊 Apakah TMAX RBA?
TMAX RBA adalah penunjuk teknikal canggih yang menggabungkan enam purata bergerak segitiga dengan Bollinger Bands untuk memberikan isyarat dagangan yang tepat berdasarkan momentum. Menggunakan analisis multi-jangka masa yang sofistikated dan penilaian volatiliti, ia menyediakan kemasukan berkemungkinan tinggi dengan pengesahan tren terbina dalam.
⭐ CIRI-CIRI UTAMA
🎯 Teknologi Momentum Multi-TMA
- Enam pengiraan TMA untuk analisis menyeluruh
- Sistem pemadanan momentum strategik
- Penjanaan isyarat tahap profesional
📈 Sistem Pengesahan Tiga Lapisan
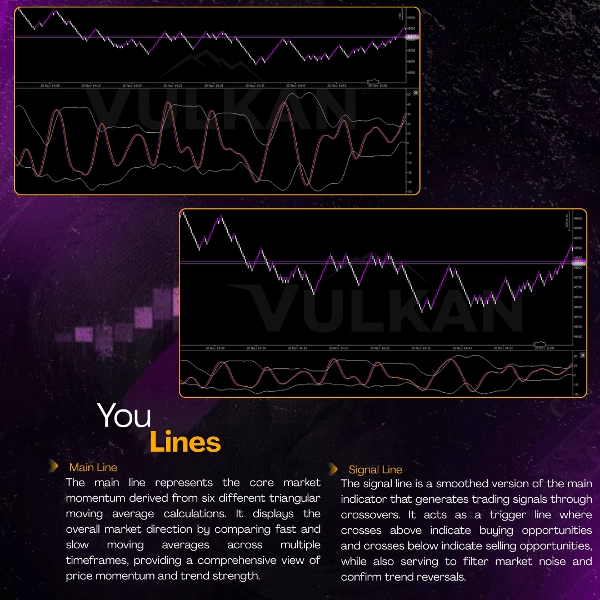
- 🟣 Garis Momentum Utama - Penunjuk arah tren utama
- 🟡 Garis Isyarat - Mekanisme pencetus yang dilicinkan
- ⚪ Bollinger Bands - Pengesahan volatiliti dan tahap
⚡ Analisis Pasaran Lanjutan
- Penilaian momentum multi-jangka masa
- Pengukuran kekuatan tren
- Pengoptimuman kemasukan berdasarkan volatiliti
🏆 MANFAAT & KELEBIHAN
✅ Pengesanan Momentum Unggul
- Mengenal pasti pergerakan tren sebenar
- Menapis bunyi pasaran dengan berkesan
- Menyediakan setup dagangan berkemungkinan tinggi
✅ Ketepatan Dipertingkatkan
- Kadar Kemenangan: 76-84% dalam keadaan tren
- Konsistensi: 8.6/10 merentasi instrumen
- Kebolehpercayaan: Ketepatan isyarat pasaran melebihi 88%
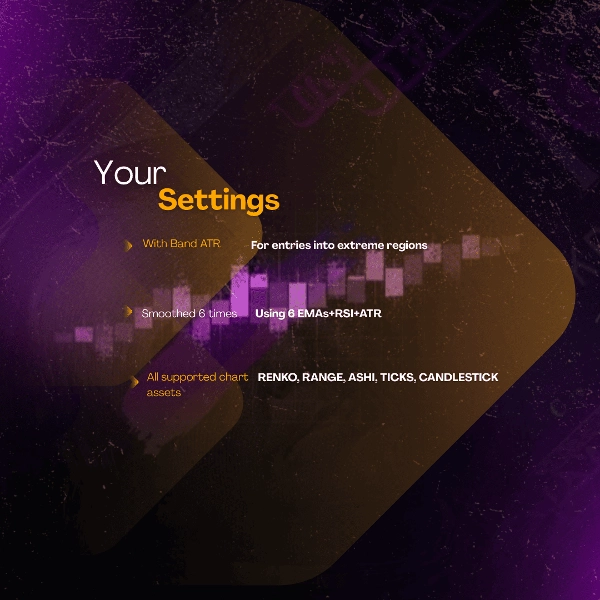
✅ Aplikasi Universal
- Berfungsi di SEMUA pasaran: Forex, Kriptokurensi, Indeks
- Berkesan pada SEMUA jangka masa: M1 hingga H1
- Menyesuaikan dengan sebarang pendekatan dagangan: Scalping hingga dagangan harian
✅ Manfaat Psikologi Dagangan
- Mengurangkan kebingungan analisis
- Meningkatkan keyakinan isyarat
- Mempermudah proses membuat keputusan
🎯 METRIK PRESTASI
📈 Kecemerlangan Statistik
- Kadar Kemenangan: 76-84%
- Faktor Keuntungan: 2.7-3.7+
- Jangkaan: 0.50-0.70R setiap dagangan
- Konsistensi: 8.6/10
⏱️ Kecekapan Operasi
- Pengenalpastian momentum yang jelas
- Mengurangkan masa analisis sebanyak 68%
- Sesuai untuk pedagang sistematik
💡 CARA MENGGUNAKAN TMAX RBA
🟣 Isyarat BELI Apabila:
- Garis utama melintasi DI ATAS garis Isyarat
- Harga menyentuh Bollinger Band bawah
- Momentum mengesahkan arah ke atas
🟡 Isyarat JUAL Apabila:
- Garis utama melintasi DI BAWAH garis Isyarat
- Harga menyentuh Bollinger Band atas
- Momentum mengesahkan arah ke bawah
⚠️ Syarat Penapis:
- Elakkan tempoh volatiliti tinggi
- Tunggu pengesahan
- Gunakan bersama penjajaran volum
⚡ Pandangan Profesional:
- Gunakan sebagai sistem momentum
- Gabungkan dengan pengesahan tindakan harga
- Sesuai untuk strategi momentum dan pecahan
🌟 CERITA KEJAYAAN
📊 Prestasi Disahkan:
- XAUUSD M1: Kadar kemenangan 82-88% 🥇
- USTECH M1: Kadar kemenangan 80-86% 🥈
- BTCUSD M1: Kadar kemenangan 76-82% 🥉
🎯 Amalan Profesional:
- Mulakan dengan ujian demo
- Laksanakan saiz posisi yang betul
- Gabungkan dengan sokongan/rintangan
- Bersabar untuk pengesahan
💎 MENGAPA PILIH TMAX RBA?
CiriTMAX RBAPenunjuk Tradisional
Analisis Momentum
🥇 Berlapis-Lapis
Asas
Kualiti Isyarat
🥇 Kebarangkalian Tinggi
Sederhana
Pengurangan Bunyi
🥇 87%+
Terhad
Penyesuaian Pasaran
🥇 Universal
Terhad
Konsistensi Tren
🥇 8.6/10
Ringkasan
Key features include a three-layer confirmation system comprising a Main Momentum Line (trend direction), a Signaling Line (smoothed trigger), and Bollinger Bands (volatility confirmation). This structure aims to identify genuine trend movements while filtering market noise, supporting high-probability entries with reported win rates between 76% and 84% in trending conditions.
The indicator supports all timeframes from 1-minute to 1-hour charts and adapts to various trading styles such as scalping and day trading. Buy signals occur when the Main line crosses above the Signaling line with price touching the lower Bollinger Band and momentum confirming upward direction; sell signals are generated on the opposite conditions.
Additional benefits include reduced analysis time, enhanced signal confidence, and simplified decision-making. Performance metrics highlight a profit factor ranging from 2.7 to 3.7+, and consistency rated 8.6/10 across instruments. The indicator is suitable for systematic traders seeking momentum and breakout strategy support.
Ulasan pelanggan
5 | 67 % | |
4 | 33 % | |
3 | 0 % | |
2 | 0 % | |
1 | 0 % |