คำอธิบาย
โปรไฟล์ปริมาณสวิง (SVP)
โปรไฟล์ปริมาณตามสวิง + ฟีโบนัชชี + RSI
--------------------------------------------------
การตรวจจับสวิง โปรไฟล์ปริมาณ ฟีโบนัชชี RSI รวมอยู่ในตัวเดียว
--------------------------------------------------
สิ่งที่ตัวบ่งชี้นี้ทำ
Swing Volume Profile (SVP) ตรวจจับสวิงโครงสร้างโดยอัตโนมัติและแสดงโปรไฟล์ปริมาณสำหรับสวิงที่เสร็จสมบูรณ์ล่าสุด — พร้อมการทับซ้อนฟีโบนัชชีและ RSI
ไม่ต้องเลือกช่วงด้วยตนเอง ตัวบ่งชี้จะค้นหาสวิงและสร้างโปรไฟล์โดยอัตโนมัติ
--------------------------------------------------
คุณสมบัติหลัก
- การตรวจจับสวิงอัตโนมัติ (ปรับความลึกและความเบี่ยงเบนได้)
- โปรไฟล์ปริมาณสำหรับสวิงที่เสร็จสมบูรณ์ล่าสุด
- จุดควบคุม (POC) - ระดับปริมาณสูงสุด
- พื้นที่มูลค่า (VAH + VAL) - เปอร์เซ็นต์ที่ปรับได้
- โหนดปริมาณสูง (HVN) - ปริมาณเหนือเกณฑ์เฉลี่ย
- การถดถอยฟีโบนัชชี (0, 23.6, 38.2, 50, 61.8, 78.6, 100)
- การทับซ้อน RSI ใกล้ราคาปัจจุบัน
- การจัดตำแหน่งฮิสโตแกรม: ซ้าย ขวา หรือใกล้แท่ง
- แถวที่ปรับได้ (10 ถึง 200)
- สีและความทึบที่ปรับแต่งได้
- ขยายเส้นไปทางขวา
- แสดง/ซ่อนป้ายราค
- ไม่มีการวาดซ้ำ
--------------------------------------------------
วิธีการทำงาน
1. ตัวบ่งชี้ตรวจจับสวิงโดยใช้ความลึกและความเบี่ยงเบนที่ปรับได้
2. ระบุสวิงที่เสร็จสมบูรณ์ล่าสุด
3. คำนวณโปรไฟล์ปริมาณจากช่วงสวิง
4. แสดง POC, VAH, VAL, HVN
5. ทับซ้อนการถดถอยฟีโบนัชชีบนสวิง
6. แสดง RSI ปัจจุบันใกล้ราคาปัจจุบัน
ทั้งหมดเป็นอัตโนมัติ ไม่ต้องป้อนข้อมูลด้วยตนเอง
--------------------------------------------------
องค์ประกอบภาพ
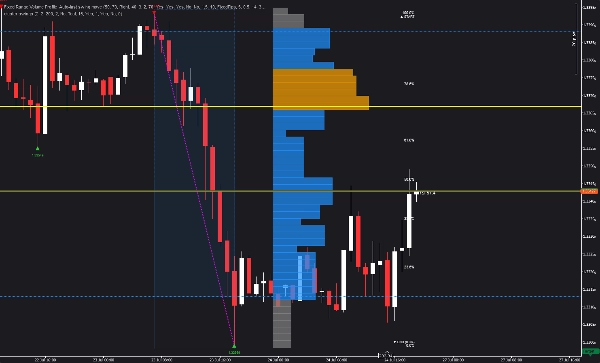
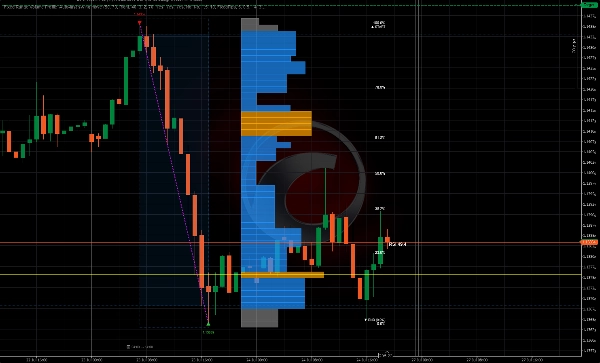
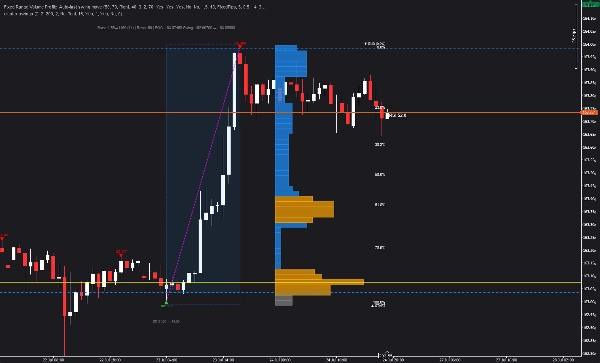
- สามเหลี่ยมสีแดงลง = จุดสูงสุดของสวิง
- สามเหลี่ยมสีเขียวขึ้น = จุดต่ำสุดของสวิง
- เส้นประสีม่วง = การเชื่อมต่อสวิง
- เส้นแนวนอนสีเหลือง = จุดควบคุม (POC)
- เส้นประสีน้ำเงิน = ค่าพื้นที่สูง (VAH) และค่าพื้นที่ต่ำ (VAL)
- แท่งสีส้ม = โหนดปริมาณสูง (HVN)
- แท่งสีเทา = โหนดปริมาณต่ำ
- เส้นแนวนอนสีทอง = ระดับฟีโบนัชชี
- ป้ายสีขาว = เปอร์เซ็นต์ฟีโบนัชชี
- ค่าของ RSI = RSI ปัจจุบันใกล้ราคา
--------------------------------------------------
ภาพรวมพารามิเตอร์
การตั้งค่าโปรไฟล์:
- จำนวนแถว: จำนวนแถวราคา (10-200)
- เปอร์เซ็นต์พื้นที่มูลค่า: % ของปริมาณในพื้นที่มูลค่า (1-100)
การตั้งค่าภาพ:
- ตำแหน่งฮิสโตแกรม: ขวา ซ้าย ใกล้แท่ง หรือใกล้แท่งซ้าย
- ความกว้างฮิสโตแกรม %: ความกว้างของแท่งฮิสโตแกรม
- การปรับขนาดความกว้างแท่ง: ตัวคูณสำหรับความกว้างแท่ง
- ความกว้างแท่งขั้นต่ำ %: ความกว้างแท่งขั้นต่ำ
- ความทึบแท่ง: ความโปร่งใสของแท่ง (10-100)
การตรวจจับสวิง:
- ความลึกสวิง: จำนวนแท่งที่ตรวจสอบจุดสูงต่ำท้องถิ่น
- โหมดความเบี่ยงเบน: พิกเซลคงที่หรือแบบใช้ ATR
- ความเบี่ยงเบนคงที่: ระยะห่างพิกเซลขั้นต่ำระหว่างสวิง
- ตัวคูณความเบี่ยงเบน ATR: ตัวคูณสำหรับความเบี่ยงเบนแบบใช้ ATR
- ระยะเวลา ATR: ระยะเวลาสำหรับการคำนวณ ATR
- การถอยหลัง: จำนวนแท่งขั้นต่ำระหว่างสวิง
ภาพ - สวิง:
- แสดงเส้นสวิง: เปิด/ปิดเส้นสวิงสีม่วง
- สีเส้นสวิง
- แสดงป้ายสวิง: เปิด/ปิดป้ายราคา
- สีสวิงสูง/ต่ำ
ภาพ - ฟีโบนัชชี:
- แสดงการถดถอยฟีโบนัชชี: เปิด/ปิดการทับซ้อนฟีโบนัชชี
- แสดงเส้นฟีโบนัชชี: เปิด/ปิดเส้นแนวนอน
- แสดงป้ายฟีโบนัชชี: เปิด/ปิดป้ายเปอร์เซ็นต์
- สีเส้นฟีโบนัชชี / สีข้อความฟีโบนัชชี
ภาพ - RSI:
- แสดงค่า RSI: เปิด/ปิดการทับซ้อน RSI
- ระยะเวลา RSI: ระยะเวลาสำหรับการคำนวณ RSI
- สีป้าย RSI
สี:
- สี POC / สีพื้นที่มูลค่า / สีโหนดปริมาณสูง / สีปริมาณต่ำ
--------------------------------------------------
กรณีการใช้งาน
- ระบุสวิงและการกระจายปริมาณในมุมมองเดียว
- ค้นหาจุดควบคุม (POC) สำหรับการเข้าและออก
- ใช้พื้นที่มูลค่า (VAH/VAL) สำหรับเป้าหมายกำไร
- สังเกตโหนดปริมาณสูง (HVN) สำหรับระดับสำคัญ
- ใช้การถดถอยฟีโบนัชชีกับสวิง
- ยืนยันการเทรดด้วยความสอดคล้องของ RSI
- เข้าใจการกระจายปริมาณในพริบตา
--------------------------------------------------
อัปเกรดเป็นโซนความร้อนเชิงโครงสร้าง
ตัวบ่งชี้นี้แสดงสวิงและการกระจายปริมาณให้คุณ
โซนความร้อนเชิงโครงสร้างก้าวไปอีกขั้น — มันทำแผนที่ความเข้มข้นของการมีส่วนร่วม การยอมรับเทียบกับการปฏิเสธ และการมีส่วนร่วมของตลาดในหลายโซน
ค้นหาโซนความร้อนเชิงโครงสร้างในร้าน cTrader
--------------------------------------------------
อัปเกรดเป็น Invictus EA
Invictus EA ใช้เทคโนโลยีเชิงโครงสร้างเพื่อดำเนินการเทรดอัตโนมัติ
ค้นหา Invictus ในร้าน cTrader
--------------------------------------------------
บันทึกทางเทคนิค
- ตัวบ่งชี้ทับซ้อน
- ใช้งานได้กับทุกกรอบเวลาและสัญลักษณ์
- ไม่มีการวาดซ้ำ (คำนวณย้อนหลัง)
- ปรับแต่งเพื่อประสิทธิภาพ
--------------------------------------------------
การสนับสนุน
รวมการอัปเดตตลอดชีพ
สำหรับข้อมูลเพิ่มเติม - คลิกโปรไฟล์ผู้พัฒนาด้านล่าง
สรุป
The indicator identifies swings using configurable parameters such as swing depth and deviation mode (fixed pips or ATR-based), then computes volume distribution within the swing range without requiring manual range selection. Visual elements include colored markers for swing highs and lows, volume nodes, Fibonacci levels, and RSI values, all customizable in terms of color, opacity, and histogram positioning.
Key features include no repainting, configurable rows for volume profile resolution, extendable lines, and toggleable price labels. Use cases focus on identifying swing structures, volume distribution, key price levels, and confluences for trade entries, exits, and profit targets. The indicator is optimized for performance and provides lifetime updates.