
Penerangan
PROFIL ISIPADU INSTITUSI - Alat Analisis Pasaran Lanjutan
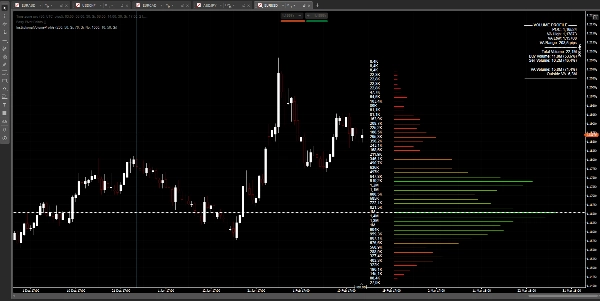
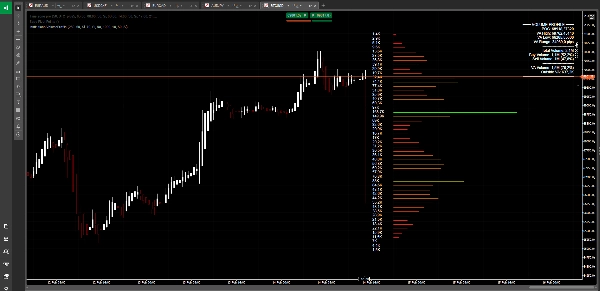
Temui di mana pedagang institusi meletakkan posisi mereka dengan penunjuk profil isipadu tahap profesional ini. Berbeza dengan alat isipadu asas, penunjuk ini mendedahkan struktur pasaran sebenar dengan menunjukkan dengan tepat di mana kebanyakan aktiviti perdagangan telah berlaku.
CIRI-CIRI UTAMA:
🎯 Titik Kawalan (POC)
Kenal pasti dengan segera tahap harga dengan isipadu perdagangan tertinggi - titik keseimbangan pasaran di mana aktiviti institusi tertumpu.
📊 Analisis Kawasan Nilai
Visualisasikan julat harga yang mengandungi 70% daripada semua isipadu perdagangan. Di sinilah "nilai adil" wujud dan di mana harga cenderung untuk bergerak.
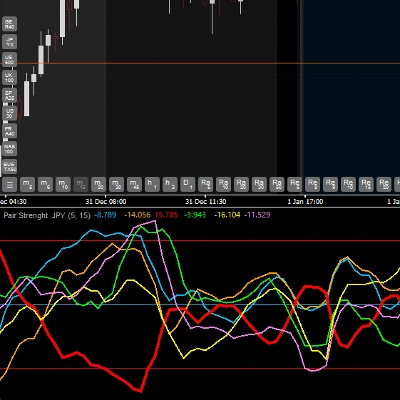
💹 Analisis Sentimen Beli/Jual
Lihat keseimbangan kuasa antara pembeli dan penjual dengan pecahan peratusan masa nyata. Ketahui sama ada lembu jantan atau beruang mengawal.
🎨 Gradasi Warna Pintar
Zon isipadu tinggi muncul dalam hijau terang, manakala kawasan isipadu rendah dipaparkan dalam merah. Segera kenal pasti zon kecairan dan kawasan potensi pecahan.
📈 Persembahan Profesional
Paparan bersih dan tidak mengganggu dengan bar isipadu yang memanjang dari tindakan harga. Nombor diletakkan dengan jelas untuk bacaan mudah pada mana-mana tahap zum.
⚙️ Sepenuhnya Boleh Disesuaikan
Laraskan tempoh tinjauan, bilangan tahap harga, warna, dan pilihan paparan untuk menyesuaikan gaya perdagangan anda.
SEMPURNA UNTUK:
• Mengenal pasti tahap sokongan dan rintangan utama
• Mengesan nod isipadu rendah (LVN) untuk potensi pecahan
• Mencari nod isipadu tinggi (HVN) di mana harga mungkin mengukuh
• Memahami penempatan institusi
• Mengesahkan kemasukan dan keluar perdagangan
• Analisis pelbagai jangka masa
Sama ada anda seorang pedagang harian, pedagang ayunan, atau pedagang posisi, alat ini memberi anda kelebihan dengan menunjukkan apa yang penunjuk tradisional tidak dapat: di mana wang pintar beroperasi.
---
⚠️ PENAFIAN RISIKO:
Perdagangan pertukaran asing, mata wang kripto, dan instrumen kewangan lain membawa tahap risiko yang tinggi dan mungkin tidak sesuai untuk semua pelabur. Tahap leverage yang tinggi boleh memberi kesan negatif serta positif kepada anda. Sebelum memutuskan untuk berdagang, anda harus mempertimbangkan dengan teliti objektif pelaburan, tahap pengalaman, dan selera risiko anda. Terdapat kemungkinan anda mengalami kerugian sebahagian atau keseluruhan pelaburan anda. Oleh itu, anda tidak harus melabur wang yang anda tidak mampu kehilangan. Anda harus sedar tentang semua risiko yang berkaitan dengan perdagangan dan mendapatkan nasihat daripada penasihat kewangan bebas jika anda mempunyai sebarang keraguan. Prestasi lalu tidak menunjukkan hasil masa depan.
Ringkasan
- Point of Control (POC): Identifies the price level with the highest trading volume, indicating market equilibrium.
- Value Area Analysis: Displays the price range containing 70% of trading volume, representing the "fair value" zone.
- Buy/Sell Sentiment Analysis: Provides real-time percentage breakdowns of buying and selling pressure.
- Smart Color Gradient: Uses color coding to distinguish high-volume zones (bright green) from low-volume zones (red), aiding in spotting liquidity and breakout areas.
- Professional Presentation: Volume bars extend from price action with clear numeric labels, optimized for readability at any zoom level.
- Full Customization: Allows adjustment of lookback period, price levels, colors, and display settings.
This tool supports multi-timeframe analysis and is suitable for identifying key support/resistance levels, spotting low- and high-volume nodes, understanding institutional positioning, and confirming trade entries and exits. It is applicable across markets including Forex, indices, and symbols like XAUUSD and NAS100.
Ulasan pelanggan
5 | 33 % | |
4 | 33 % | |
3 | 0 % | |
2 | 33 % | |
1 | 0 % |


![Logo "Smart Money Concepts (SMC) [Iridio Capital]"](https://cdn.ctrader.com/image/webp/28b69fd1-ef54-4bed-9487-07e78e883be4_40934)
