
Penerangan
Kumpulan 3 kumpulan band biasa:
tempoh:20
Penyimpangan:2.0;3.0; 3.5;
Dikuasakan dengan latar awan!
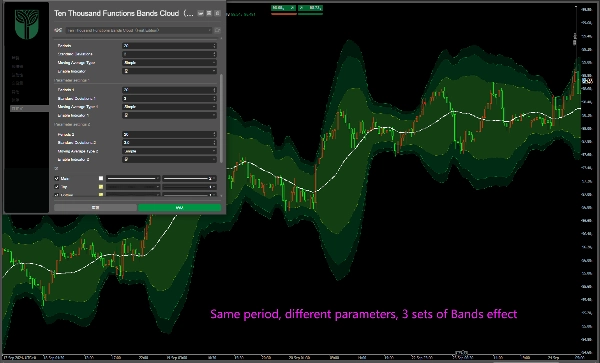
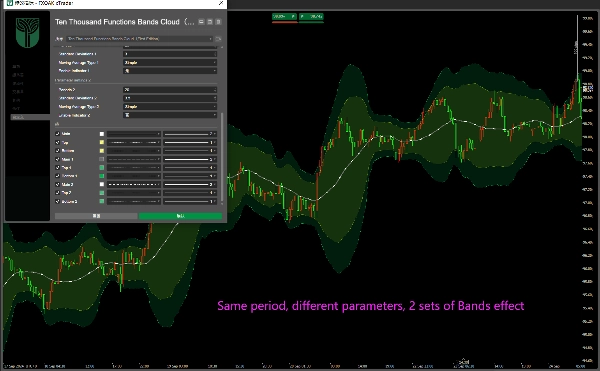
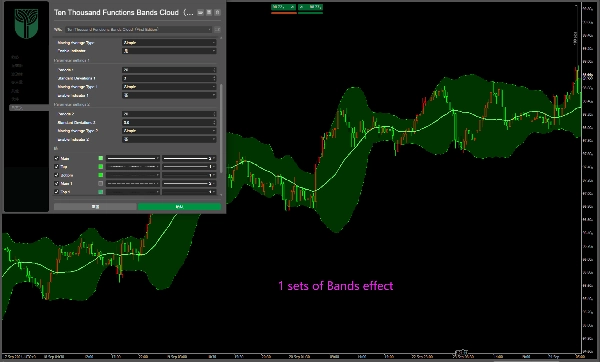
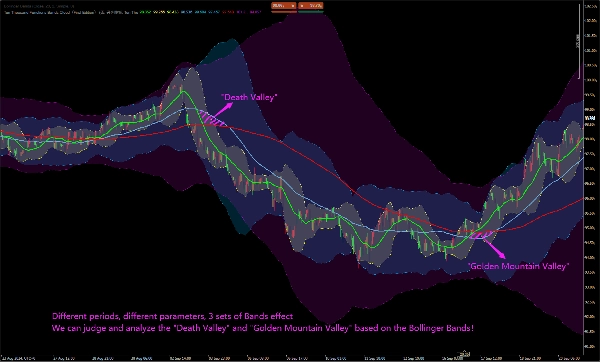
Anda boleh menutup atau membuka mana-mana satu atau dua kumpulan; Dan parameter yang berbeza boleh diubah dan ditetapkan!
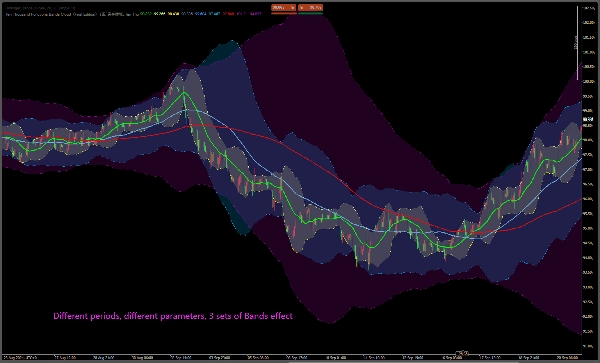
Ia juga boleh diubah kepada nilai lain, seperti 2.0:20, 60, 144Bands;
Jejak tengah Bands adalah sama dengan purata bergerak, iaitu purata bergerak 20, 60, dan 144!
Kita boleh menilai dan menganalisis "Lembah Kematian" dan "Lembah Gunung Emas" berdasarkan jejak tengah Bollinger Bands!
常规3组Bands:
周期:20
偏差:2.0;3.0; 3.5;
支持云背景!
您可以关闭或打开任意一个或两个组;并且可以修改和设置不同的参数!
它也可以修改为其他值,如2.0:20、60、144布林带;
Bands中轨等于移动平均线,即20、60和144移动平均线!
我们可以根据布林中轨迹来判断和分析“死亡谷”和“金山谷”等......
標準3グループボリンジャーバンド(Bands):期間:20;偏差値:2.0;3.0;3.5;クラウドバックグラウンドに対応!任意の1グループまたは2グループをオン/オフ設定することが可能です。また、各パラメーターの修正と設定も行えます。他の数値に変更することも可能です。例えば2.0の偏差値で、期間20、60、144のボリンジャーバンドに設定するなど。ボリンジャーバンドの中線は移動平均線に等しく、すなわち期間20、60、144の移動平均線です。ボリンジャーバンドの中線に基づいて、「デッドバレー(死亡谷)」や「ゴールドバレー(金山谷)」などを判断・分析することができます。
Стандартные 3 группы Бандов (Полос Боллинджера): Период: 20; Отклонение: 2,0; 3,0; 3,5; Поддержка облачного фона! Вы можете отключить или включить любую одну или две группы; кроме того, вы можете изменять и настраивать различные параметры! Его также можно изменить на другие значения, например, Боллинджеры с отклонением 2,0 и периодами 20, 60, 144; Средняя линия Бандов равна скользящей средней, то есть скользящим средним с периодами 20, 60 и 144! Мы можем определять и анализировать такие явления, как «Мёртвая долина» и «Золотая долина», на основе средней линии 。
Ringkasan
Ulasan pelanggan
5 | 100 % | |
4 | 0 % | |
3 | 0 % | |
2 | 0 % | |
1 | 0 % |


