
Weekly Daily Levels
Indikator
2 pembelian
Versi 1.0, Aug 2025
Windows, Mac
5.0
Ulasan: 2
Penerangan
Adakah anda bergantung pada harga OHLC harian dan mingguan serta harga titik tengah dalam strategi perdagangan anda? Penat menandakan mereka secara manual setiap kali anda membuat perdagangan?
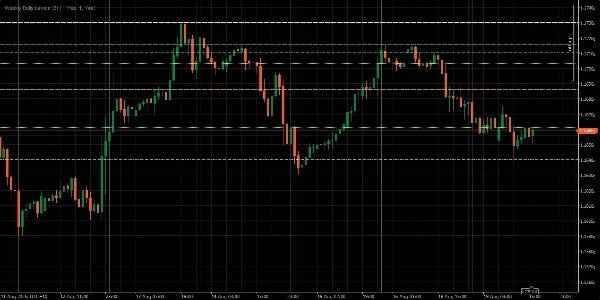
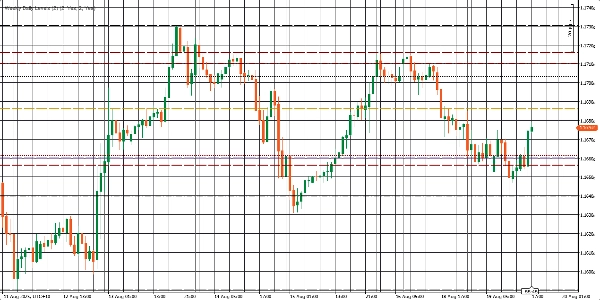
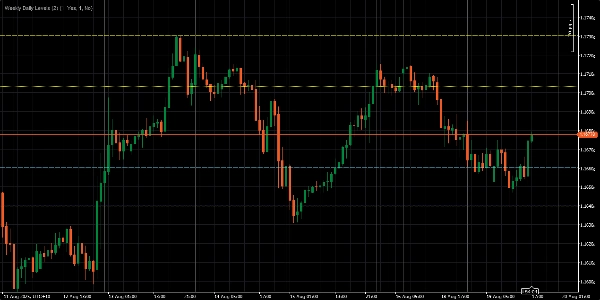
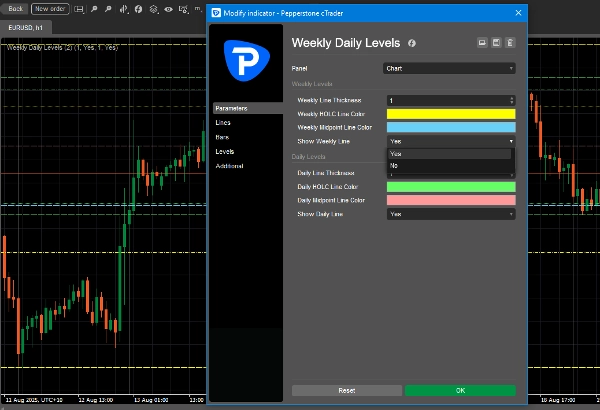
The Weekly Daily Levels Indicator melakukan kerja berat untuk anda. Ia secara automatik melukis harga buka, tinggi, rendah, tutup (OHLC) dan titik tengah hari sebelumnya dan minggu sebelumnya terus pada carta anda. Ini bermakna anda boleh menumpukan pada melaksanakan strategi anda sementara penunjuk menguruskan butiran—menjadikan perdagangan anda lebih mudah, pantas, dan jauh lebih cekap.
Ciri Utama:
- Memaparkan harga OHLC harian dan mingguan serta titik tengah dengan serta-merta.
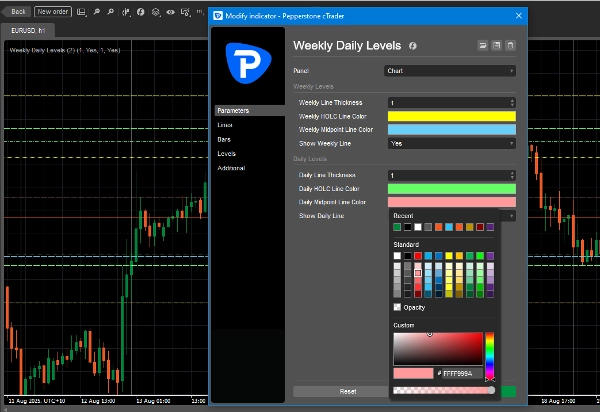
- Sesuaikan warna garis untuk padan dengan gaya carta anda.
- Hidupkan atau matikan tahap harian atau mingguan dengan satu klik.
- Laraskan ketebalan garis untuk penglihatan yang lebih baik.
Ringkasan
Ringkasan AI
The Weekly Daily Levels indicator automatically plots the previous day’s and previous week’s open, high, low, close (OHLC) prices along with their mid-points directly on trading charts. It provides instant visual reference to these key price levels, helping traders incorporate daily and weekly price data into their strategies without manual marking. Users can customize line colors and thickness to fit their chart style and toggle daily or weekly levels on or off with a single click. This indicator streamlines the process of tracking important historical price levels for improved trading efficiency.
Profil indikator
Ulasan pelanggan
5.0
Ulasan: 2
5 | 100 % | |
4 | 0 % | |
3 | 0 % | |
2 | 0 % | |
1 | 0 % |
Ulasan pelanggan
August 28, 2025
Not bad if the rules are already clear. Two timeframes give more context.
August 21, 2025
the good surprise is the setup needs less second guessing, and It works better with a written plan.
Perbincangan
Soalan Lazim
Produk yang tersedia melalui cTrader Store, termasuk bot dagangan, indikator dan plugin, disediakan oleh pembangun pihak ketiga dan diberikan akses untuk tujuan maklumat dan teknikal sahaja. cTrader Store bukan broker dan tidak memberikan nasihat pelaburan, syor peribadi atau sebarang jaminan prestasi masa hadapan.


![Logo "[CB] Pivot Points Pro"](https://cdn.ctrader.com/image/webp/43463c82-67b0-4f10-a4ba-901bba091d81_32594)


Harga
Sejak 19/04/2025
2
Jualan