
Описание
QX FrameForge — это наложение панели состояния рынка с несколькими таймфреймами для cTrader. Она сжимает происходящее на нескольких таймфреймах в быструю, читаемую панель, чтобы вы могли торговать с контекстом, а не угадывать.
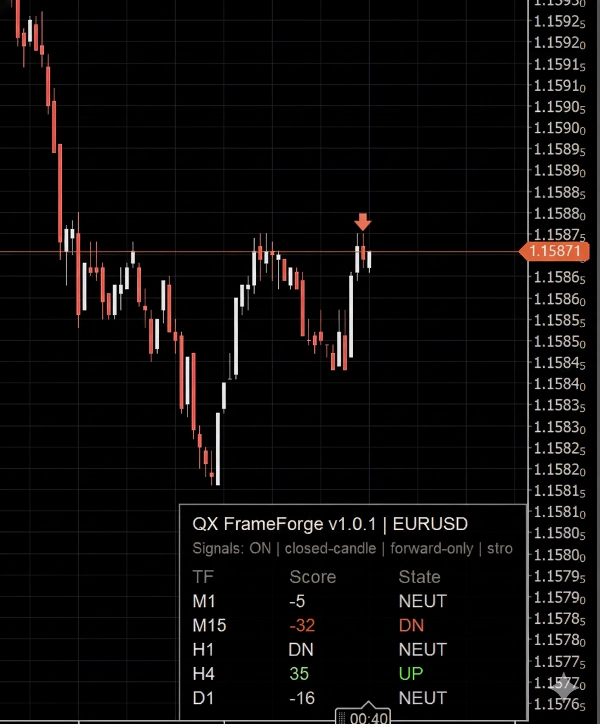
Для каждого выбранного таймфрейма панель показывает:
- TF (таймфрейм)
- Score (-100 до +100) для выражения направления и силы
- State: UP / NEUT / DN для быстрых решений
Опциональные стрелки можно включить для отметки подтверждений с использованием только закрытых свечей, что сохраняет стабильность графика и избегает мерцания внутри бара.
Как читать это (для начинающих)
Думайте о панели как о измерителе направления:
- Положительный Score и UP означают бычьи условия на этом таймфрейме
- Отрицательный Score и DN означают медвежьи условия на этом таймфрейме
- NEUT означает, что условия смешанные, боковые или недостаточно сильные для направления
Настройка нейтральной зоны контролирует, насколько легко индикатор переключается в NEUT. Более широкая нейтральная зона даёт меньше направленных состояний (более консервативно).
Что внутри Score (на высоком уровне)
Score объединяет:
- компонент тренда (направление и наклон)
- компонент моментума (сила продолжения против колебаний)
- опциональный фильтр волатильности для снижения шумных периодов
Результат — ограниченный Score, предназначенный для согласования нескольких таймфреймов, а не для «магических входов».
Как трейдеры обычно используют FrameForge
1) Согласование нескольких таймфреймов
- Предпочитайте сделки, когда старшие таймфреймы совпадают (пример: H1 + H4 оба UP)
- Используйте младший таймфрейм (пример: M5) для тайминга
2) Фильтрация режимов
- Слишком много NEUT обычно означает флэт и условия низкого качества
- Смешанное направление старших таймфреймов предполагает осторожность или меньшую экспозицию
3) Слой подтверждения
- Используйте FrameForge, чтобы подтвердить, что ваша установка согласована, прежде чем входить в сделку
Опциональные стрелки (сигналы)
Стрелки — это опциональный визуальный помощник. Они оцениваются только по последней закрытой свече.
Вы можете выбрать, как стрелки срабатывают:
- только когда сила пересекает порог,
- только когда меняется направленное состояние,
- или чаще, когда условия остаются сильными.
Включены элементы управления для:
- порога силы
- времени восстановления (минимум баров между стрелками)
- один сигнал за колебание (уменьшает повторяющиеся стрелки в одном направлении)
- лимит иконок (предотвращает загромождение графика)
Важно: стрелки предназначены быть только вперед с момента их включения, чтобы избежать спама историческими объектами и вводящих в заблуждение ретроспективных визуальных эффектов.
Совместимость
- Работает с любым символом cTrader и любым таймфреймом графика
- Только индикатор. Заказы не размещаются.
- Оптимизированные обновления интерфейса для поддержания отзывчивости графиков.
Отказ от ответственности по рискам
Торговля связана с риском. Прошлые результаты не гарантируют будущих.
Сводка
The Score integrates trend direction and slope, momentum strength, and an optional volatility filter to reduce noise, producing a bounded metric aimed at multi-timeframe alignment rather than precise entry signals. Traders typically use FrameForge for aligning trades across timeframes (e.g., confirming higher timeframe trends before timing entries on lower timeframes), filtering market regimes by identifying choppy or mixed conditions, and adding a confirmation layer to their setups.
Arrow signals can be customized by strength thresholds, directional changes, cooldown periods, and icon limits to avoid chart clutter. The indicator works on any cTrader symbol and timeframe, updating efficiently to maintain chart responsiveness. It does not place orders and serves solely as a visual analytical tool.
Отзывы покупателей
5 | 100 % | |
4 | 0 % | |
3 | 0 % | |
2 | 0 % | |
1 | 0 % |


