
Açıklama
QX Candle Pressure Index cTrader için mum basıncı bindirmesidir mum kapanışlarının kendi aralığında ne kadar güçlü olduğunu okumaya yardımcı olur.
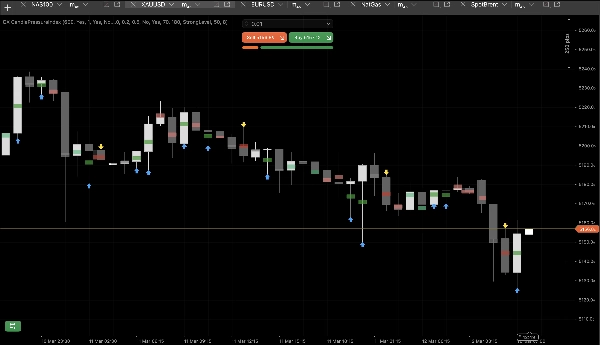
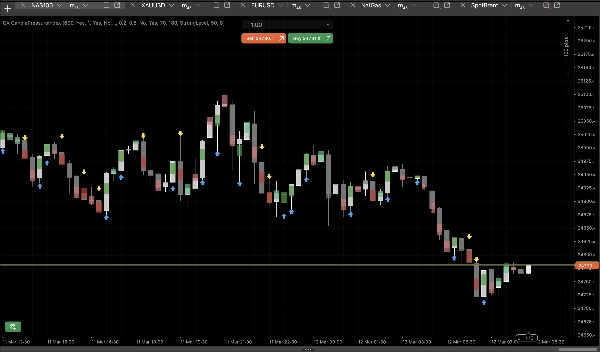
Ayrı bir osilatör penceresi kullanmak yerine, CPI basıncı ana grafik üzerinde kompakt orta nokta işaretçileriyle doğrudan gösterir. Bu, kapanış gücünü, yükseliş veya düşüş eğilimini ve kısa vadeli momentumu daha az görsel gürültü ile okumayı kolaylaştırır.
Ana Kullanımlar
CPI, traderların şunlara yardımcı olmak için tasarlanmıştır:
- mum kapanış kalitesini değerlendirmek
- yönsel basıncı doğrulamak
- kırılma gücünü değerlendirmek
- düzeltmeleri daha net okumak
- momentum değişimlerini daha erken fark etmek
Nasıl Çalışır
Her mum, kendi aralığında nerede kapandığına göre sınıflandırılır:
- yüksek yakınında = yükseliş basıncı
- düşük yakınında = düşüş basıncı
- orta yakınında = nötr basınç
Bu bilgi şu şekilde gösterilir:
- orta nokta basınç işaretçileri
- 5 basınç bölgesi
- güçlü basınç için isteğe bağlı oklar
- isteğe bağlı gövde bindirmesi
Basınç Bölgeleri
CPI, mumları 5 görsel duruma ayırır:
- Güçlü Alış
- Hafif Alış
- Nötr
- Hafif Satış
- Güçlü Satış
Bu, traderların hareketin güçlü, zayıf veya dengeli olup olmadığını belirlemesine yardımcı olur.
Ana Özellikler
Orta Nokta Basınç İşaretçileri
Mum orta noktasına sabitlenmiş kompakt görsel işaretçiler.
5 Basınç Bölgesi
Güçlü, hafif ve nötr kapanışlar arasında net ayrım.
Oluşan Mumu Atla
Daha stabil okumalar için canlı mumu kapanana kadar görmezden gelir.
Nötr İşaretçileri Gizle
Grafiği sadece yönlü mumları göstererek daha temiz tutar.
Ok Modları
Güçlü yükseliş veya düşüş mumlarını görsel olarak vurgular.
Gövde Bindirmesi
Grafik okumayı kolaylaştırmak için ince ekstra bir katman ekler.
Ana Parametreler ve Kullanımı
Geçmiş Mumları Çiz
Gösterilecek geçmiş mum sayısını kontrol eder.
Oluşan Mumu Atla
Kapalı mum okuması ve daha stabil sinyaller için açın.
Hafif Eşik
Bir mumun nötr olmaktan çıkma zamanını tanımlar.
Güçlü Eşik
Basıncın güçlü hale geldiği zamanı tanımlar.
Nötr İşaretçileri Gizle
Daha temiz bir yön görünümü için kullanın.
Ok Modu
Ok olmaması, her güçlü mumda oklar veya sadece güçlü geçişlerde oklar arasında seçim yapın.
İşaretçi Ölçeği / Genişliği / Opaklığı
Görsel görünümü grafik stilinize uyacak şekilde ayarlayın.
En İyi Kullanım Alanları
- trend devamı doğrulaması
- kırılma kalitesi değerlendirmesi
- düzeltme analizi
- kısa vadeli momentum okuması
- daha temiz fiyat hareketi yorumu
Özet
QX Candle Pressure Index mum basıncını grafik üzerinde doğrudan okumak isteyen traderlar için başka bir gösterge penceresi eklemeden temiz bir görsel araçtır.
Özet
Müşteri değerlendirmeleri
5 | 50 % | |
4 | 50 % | |
3 | 0 % | |
2 | 0 % | |
1 | 0 % |


