
✅ Kotak Sokongan & Rintangan Isipadu Tinggi — secara automatik memetakan zon “pertahanan / pecah” sebenar
✅ Kekuatan Zon Berbobot Isipadu (ketelusan dinamik) — isipadu lebih kuat = kehadiran kotak lebih kuat
✅ Penciptaan Zon Berasaskan Pivot (Lookback) — hanya tahap yang disahkan menjadi zon (kurang bunyi)
✅ Lebar Kotak Adaptif (berdasarkan ATR) — zon menyesuaikan skala dengan volatiliti semasa, bukan anggaran tetap
✅ Sambungan Kotak Langsung — zon terus meramalkan ke hadapan apabila harga berubah
✅ Kecerdasan Pecah / Pegang — mengesan bila zon bertahan vs. pecah dan bertindak segera
✅ Tanda Acara Visual (Berlian) — pengesahan “pegang / terbalik” yang jelas tanpa berfikir terlalu banyak
✅ Label Pecah — acara “Pecah Sup / Pecah Res” yang jelas pada carta
✅ Kawalan Visual Penuh — togol untuk Kotak / Teks Isipadu / Berlian / Label Pecah
✅ Sistem Pembersihan Automatik — mengelakkan kekacauan carta dengan membuang tanda acara lama secara automatik
✅ Kawalan Maksimum Kotak — had keras untuk memastikan prestasi pantas dan carta mudah dibaca
Sokongan & Rintangan (Kotak Isipadu Tinggi) bukan alat S/R asas yang mengeluarkan garis rawak.
Penunjuk ini dibina untuk menunjukkan sesuatu yang jauh lebih bernilai kepada anda:
Di mana harga mencipta minat sebenar — dan di mana ia paling mungkin bertindak balas lagi.
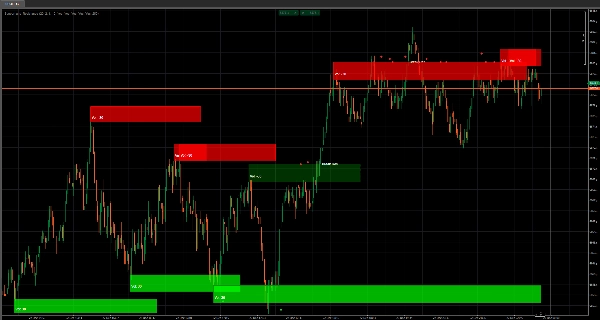
Daripada melukis “tahap cantik,” ia membina zon bekalan & permintaan isipadu tinggi sebagai kotak terus pada carta anda, supaya anda boleh berdagang struktur seperti seorang profesional:
kenal pasti zon → perhatikan tindak balas → berdagang pegangan atau pecahan.
Kelebihan Teras: Isipadu + Struktur, bukan tekaan
Setiap kotak hanya dibuat apabila dua syarat sejajar:
- Pivot yang disahkan (struktur penting)
- Isipadu ekstrem (minat penting)
Itu bermakna anda tidak akan dibanjiri dengan zon lemah.
Anda mendapat zon yang lebih sedikit — tetapi zon yang anda dapat adalah zon yang benar-benar penting.
Kekuatan Yang Boleh Dilihat (Ketelusan = Kuasa)
Di sinilah ia menjadi tidak adil bagi orang yang berdagang S/R “buta.”
Ketelusan isi kotak menyesuaikan dengan isipadu, jadi anda segera tahu:
- Kotak samar = minat ringan (perhatikan)
- Kotak kuat = minat berat (hormati)
Tiada penunjuk tambahan, tiada gimnastik tafsiran — ia benar-benar boleh dilihat.
Zon Adaptif Volatiliti (Lebar ATR)
Pasaran tidak bergerak sama setiap hari.
Penunjuk ini menyesuaikan ketebalan kotak menggunakan garis asas ATR panjang, jadi zon berkembang atau mengecil mengikut volatiliti.
Hasilnya:
zon kekal realistik bukannya terlalu nipis untuk penting atau terlalu lebar sehingga tidak berguna.
Kecerdasan Pegang vs Pecah (dan Maklum Balas Visual Segera)
Sebuah zon hanya berharga jika anda boleh membaca apa yang harga lakukan dengannya.
Penunjuk ini mengesan:
- Pegangan (penolakan / penghormatan)
- Pecahan (penerimaan melalui zon)
…dan kemudian mengemas kini gaya secara langsung:
- Pegangan mengekalkan “identiti sokongan/rintangan” asal
- Pecahan menukar tingkah laku (sokongan boleh menjadi rintangan dan sebaliknya)
- Gaya pecahan boleh bertukar kepada garis putus-putus + tona warna baru supaya anda tahu dengan segera:
“Tahap ini baru sahaja berubah wataknya.”
Berlian + Label Pecah: Pencetus keputusan yang jelas
Anda mendapat penanda acara isyarat tinggi yang mudah:
- Berlian untuk menyerlahkan acara pegang/terbalik
- Label pecah supaya anda tidak terlepas saat sesuatu tahap pecah
Ia adalah perbezaan antara berfikir sesuatu telah pecah… dan mengetahui ia benar-benar pecah.
Dibina untuk Perdagangan Sebenar: Kawalan + Carta Bersih
Penunjuk ini direka untuk kekal boleh digunakan selepas berjam-jam berdagang:
- Mahukan hanya zon? Matikan berlian/label.
- Mahukan isyarat tulen? Matikan teks isipadu.
- Mahukan prestasi? Hadkan Maksimum Kotak.
- Benci kekacauan? Acara Pembersihan Automatik memastikan carta tajam dengan membuang tanda lama secara automatik.
Anda kekal fokus pada pertempuran semasa — bukan tenggelam dalam sejarah.
Tetapan Disyorkan (Mula Pantas)
✅ Tempoh Lookback: 20 (pengesahan seimbang)
✅ Panjang Penapis Vol: 2 (responsif)
✅ Pendaraban Lebar Kotak: 1.0 (neutral)
✅ Tunjukkan Kotak: ON
✅ Berlian + Label Pecah: ON (sehingga anda belajar tingkah laku, kemudian perbaiki)
✅ Acara Pembersihan Automatik: ON (pastikan ia bersih)
Apa yang benar-benar diberikan oleh penunjuk ini kepada anda
Peta visual di mana pasaran menunjukkan kadnya — dan bacaan langsung sama ada harga menghormati zon itu atau memusnahkannya.
Jika anda berdagang pecahan, tarikan balik, pembalikan, atau ujian semula:
ini menjadi “lapisan medan pertempuran” anda.


