
설명
일일 SD 레벨 – 동적 VWAP 기반 표준 편차 밴드
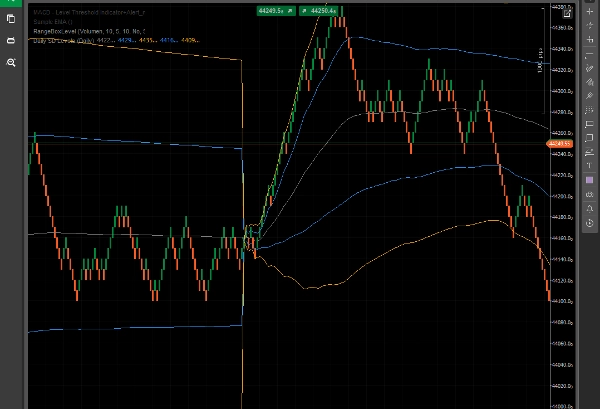
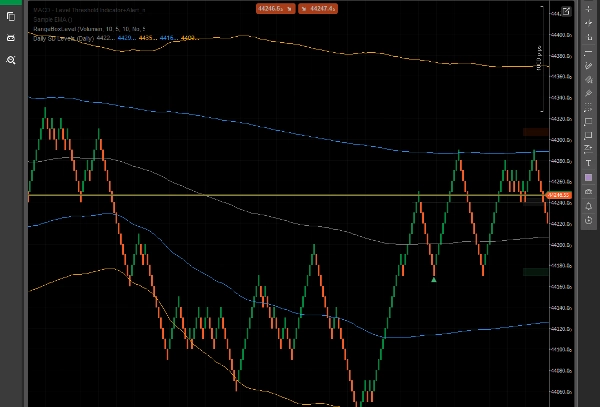
이 일일 SD 레벨 지표는 현재 거래일을 기준으로 계산된 동적 VWAP(거래량 가중 평균 가격) 및 표준 편차 밴드(+1/+2 및 -1/-2)를 표시합니다.
이 도구는 트레이더가 일중 변동성, 잠재적 지지/저항 구역 및 가격 극단값을 실제 시장 거래량과 가격 움직임을 기반으로 시각적으로 평가하는 데 도움을 줍니다 – 고정되거나 임의의 레벨이 아닙니다.
주요 특징:
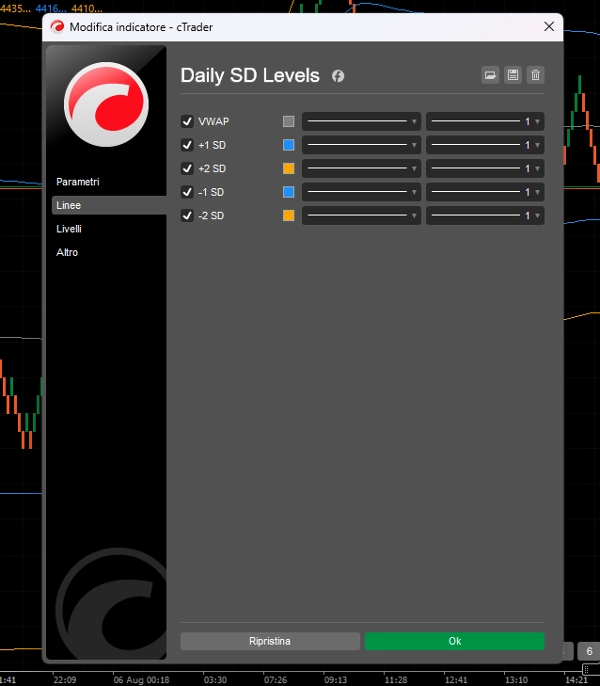
- 일중 공정 가치 추적을 위한 VWAP 라인.
- +1/+2 및 -1/-2 SD 밴드로 과매수/과매도 구역 식별.
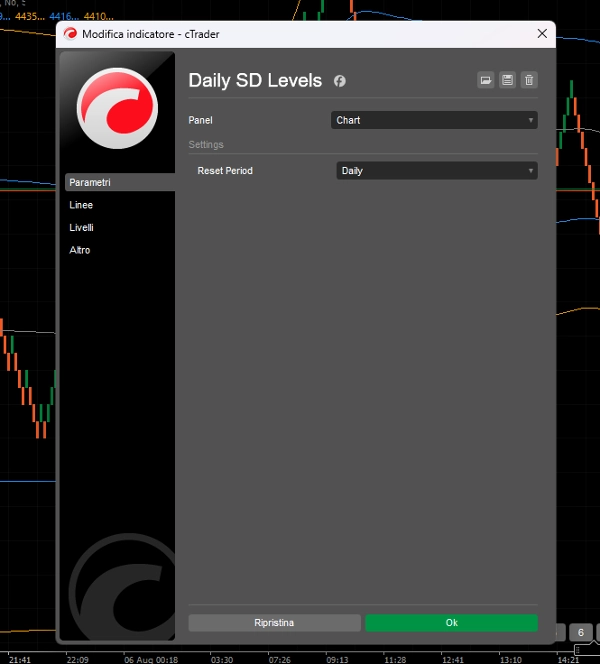
- 레벨은 매일 재설정되어 각 세션의 가격 및 거래량 동적에 적응합니다.
- Renko, Range Bar 및 일중 거래에 최적화됨.
- 명확성과 동적 가격 구역이 필요한 트레이더를 위해 구축됨.
이 지표는 다음에 적합합니다:
- 평균 회귀 설정.
- 가능한 반전을 위한 과도한 움직임 식별.
- 통계적 경계를 넘는 돌파의 시각적 확인.
복잡함 없이. 단지 깨끗하고 반응적인 레벨이 시장과 함께 움직입니다.
요약
지표 프로필
고객 리뷰
5.0
리뷰: 1
5 | 100 % | |
4 | 0 % | |
3 | 0 % | |
2 | 0 % | |
1 | 0 % |
고객 리뷰
August 8, 2025
it gives context without making the decision, but the chart still needs a human read.
상담
자주 묻는 질문(FAQ)
트레이딩 봇, 지표, 플러그인 등 cTrader Store에서 제공되는 상품은 제3자 개발자에 의해 제공되며, 이는 단순히 정보 및 기술적 접근을 목적으로 제공된 것입니다. cTrader Store는 중개인이 아니며, 투자 조언, 개인별 추천 또는 향후 성과에 대한 어떠한 보장도 제공하지 않습니다.


가격
가입일 16/07/2025
5
판매