
설명
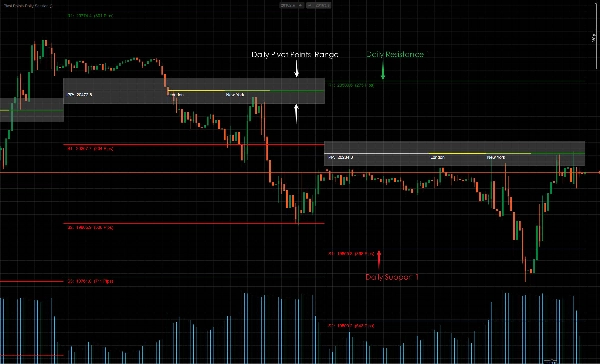
표준 피벗 포인트 계산 공식은 다음과 같습니다:
PP = (High + Low + Close)/3
S1 = (PP * 2) – High
S2 = PP – (High – Low)
S3 = Low – 2(High – PP)
R1 = (PP * 2) – Low
R2 = PP + (High – Low)
R3 = High + 2(PP – Low)
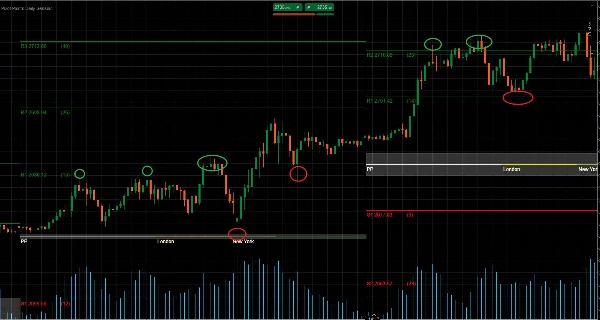
피벗 포인트는 전체 추세를 식별하는 데 사용할 수 있습니다. 피벗 포인트를 상향 돌파하는 움직임은 상승 추세를 나타냅니다. 반면, 세션 중 가격이 피벗 포인트 아래로 계속 떨어지는 경우는 하락 추세를 나타냅니다.
횡보 시장에서는 트레이더가 저항선에서 매도(숏)하고 지지선에서 매수(롱)할 수 있습니다. 예를 들어, 시장이 R1과 S1 사이에 있을 경우, 매수 주문은 S1 근처에, 매도 주문은 R1 근처에 배치됩니다.
추세 시장에서는 관련 피벗 포인트가 되돌림 시장이 주요 추세를 재개하는 기준점 역할을 합니다. 예를 들어, 상승 추세 중 가격이 PP 위에 있지만 R2 아래에 있을 때, 트레이더는 R1 근처에 수익성 있는 매수 주문을 배치할 수 있습니다.
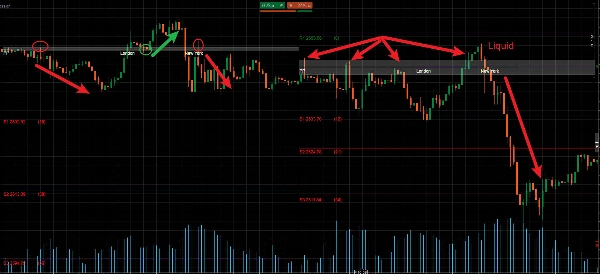
지지선과 저항선은 시장에서 일부 경우에 반드시 돌파됩니다. 이러한 돌파 기간은 시장에서 많은 거래 기회를 제공할 수 있습니다. 피벗 포인트는 또한 시장에서 잠재적인 가격 돌파를 거래하는 데 사용할 수 있습니다.
가격 돌파는 가격이 기존 지지선 또는 저항선을 돌파하여 그 역할이 효과적으로 전환될 때 발생합니다. 예를 들어, S2에서 하락 돌파가 발생하면, 피벗 라인은 더 이상 지지선이 아니며 저항선으로 간주됩니다.
이 경우, S2 아래에서는 매도 주문만 고려되며, 다른 피벗 라인은 손절매 및 이익 실현 설정에 지침이 될 수 있습니다. 매도 주문의 손절매는 S2와 S1 위에 설정할 수 있으며, 이익 목표는 S3 및 그 아래에 설정됩니다.
中文说明:
枢轴点可用于识别整体趋势,因为价格向上突破枢轴点表明上升趋势。与此同时,相反的情况,即价格在交易时段内持续跌破枢轴点,则表明下降趋势。
在区间震荡市场中,交易者可以简单地在阻力位做空(卖出)和在支撑位做多(买入)。例如,如果市场在R1和S1之间波动,买单将放置在S1附近,卖单放置在R1附近。
在趋势市场中,相关的枢轴点将作为回调市场恢复主要趋势的参考点。例如,如果在上升趋势中价格高于PP但低于R2,交易者可以考虑在R1附近设置有利可图的买单。
支撑位和阻力位在某些市场情况下必然会被突破。这些突破期可以在市场中提供许多交易机会。枢轴点也可用于交易市场中潜在的价格突破。
价格突破发生在价格冲破现有的支撑位或阻力位并有效转换其角色时。例如,如果在S2处发生向下突破,该枢轴线将不再是支撑线,而将被视为阻力线。
在这种情况下,只有在S2下方才会考虑卖单,其他枢轴线可以指导止损和止盈的设置。卖单的止损可以设在S2和S1上方,盈利目标设在S3及以下。
요약
고객 리뷰
5 | 100 % | |
4 | 0 % | |
3 | 0 % | |
2 | 0 % | |
1 | 0 % |


