설명
🚀 10,000명 이상의 트레이더가 이미 우리의 TOP 지표🏆
👉 모든 TOP 시스템을 여기에서 받으세요:
_______________________________________________
📌 시장 구조 지표
· ✅ AdvancedMarket Structure: Bos, Choch, SwinLevels, Order Blocks, Market Structure& 유동성 탐지기
· 🔄 동적 시장 구조 전환점 분석
· 🧱 주문 블록
· ⚖️ 시장 불균형
· ⛓️ BOS & CHOCH
· 🧠 ICT Power of 3
· 🌀 시장 극성 구역
_______________________________________________
🔚 스마트 종료 시스템
· 📍 추적 스마트 알고리즘
_______________________________________________
📐 지그재그 지표
· 🔍 지그재그 가격 유동성 투영
· 🧭 S&R 구조적 지그재그
· ➖ 지그재그
· 🎯 지그재그 극한 추적기
_______________________________________________
🧱 지지 및 저항 지표
· 🧱 모든 지지 및 저항 레벨
_______________________________________________
📊 추세 및 채널 지표
· 🔄 자동 추세 채널
· 📊 슈퍼트렌드
· ⚡모멘텀 추세 분석기
· 🧠 적응형 추세 채널
· 💥 채널 돌파 시스템
· 🌈 동적 추세 그라디언트
· ⭐ 프리미엄 SSL 채널
· 🔁 반응형 이동 평균
_______________________________________________
💧 거래량 및 유동성 도구
· 🔥 거래량 POC 히트맵
· 📉 레버리지 청산 지도
· 🔍 모멘텀 공정 가치 갭
· 🕒 공정 가치 갭 세션
_______________________________________________
⚡ 모멘텀 및 RSI 지표
· 📈 RSI 추세 트리거
· 🚀 동적 범위 모멘텀
_______________________________________________
🔮 예측 및 투영 도구
· 📈 거래량 기반 시장 흐름 투영기
________________________________________________________________________________________
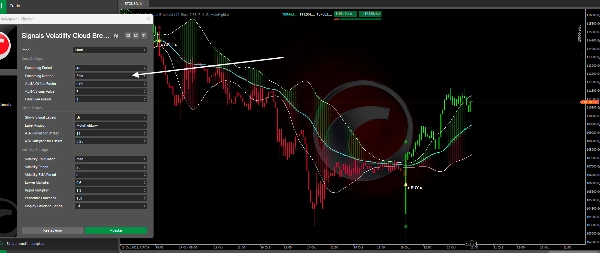
시그널 변동성 클라우드 돌파.
일반 개요 💡
Adaptive Trend Bands는 적응형 가격 필터링과 동적 변동성 밴드를 결합한 고급 추세 추종 지표입니다. 전통적인 정적 밴드 지표와 달리, 이 시스템은 변화하는 시장 상황에 따라 민감도를 자동으로 조정하여 다양한 변동성 환경에서 더 정확한 신호를 제공합니다. 🎯
이 지표는 무엇을 하나요? 🤔
이 지표는 시장 소음을 제거한 가격(OHLC)의 필터링되고 부드럽게 처리된 표현을 생성하여 기본 추세를 더 명확하게 시각화할 수 있게 합니다. 동시에 현재 변동성에 따라 자동으로 확장하거나 축소되는 상단 및 하단 밴드를 계산하여 안정적이거나 변동성이 큰 시장에 적응합니다. 🌊
주요 특징: ✨
- ALMA 또는 EMA 알고리즘을 사용한 적응형 가격 필터링
- 과거 백분위수를 사용하여 동적으로 조정되는 변동성 밴드
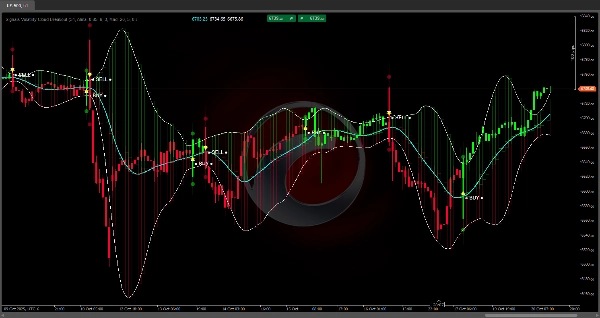
- 가격이 밴드를 교차할 때 시각적 매수/매도 신호 🟢🔴
- 감지된 추세에 따른 캔들 색상 (녹색 상승 / 빨간 하락)
- 필터링된 선 사이의 색상 구름으로 추세 강도 시각화 💪
작동 원리 ⚙️
필터링 시스템
이 지표는 가격에 대해 2단계의 평활화 과정을 적용합니다:
- 첫 번째 단계: ALMA(Arnaud Legoux 이동평균) 또는 전통적인 EMA 필터를 사용하여 단기 변동을 제거합니다. ALMA는 지연을 줄이면서 부드러움을 유지하는 데 특히 효과적입니다.
- 두 번째 단계: 첫 번째 필터 결과에 추가 EMA 평활화를 적용하여 가격 변화에 균형 있게 반응하는 매우 부드러운 추세선을 만듭니다.
적응형 변동성 계산 📏
시스템은 두 가지 방법으로 시장 변동성을 측정합니다:
- 표준 편차(StdDev): 고전적인 분산 측정 방법
- 평균 절대 편차(MAD): 극단값에 더 강건함
계산된 변동성은 평활화된 후 과거 변동성 기록과 비교되어 백분위 순위를 결정합니다. 이 백분위는 밴드 배수를 제어합니다:
- 낮은 변동성(낮은 백분위): 밴드가 가격에 더 가깝게 좁아짐 🤏
- 높은 변동성(높은 백분위): 밴드가 넓어져 움직임 공간 제공 🌐
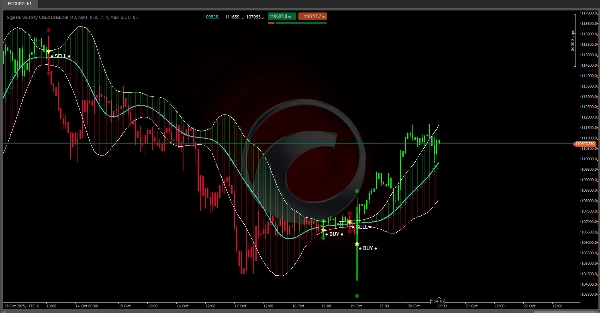
신호 생성 🔔
실제 가격이 적응형 밴드를 교차할 때 신호가 활성화됩니다:
- 신호가 활성화되면, 반대 방향의 교차가 발생할 때까지 지표는 추세 상태를 유지하여 횡보 구간에서 조기 신호를 방지합니다. 🛡️
용도는 무엇인가요? 🛠️
추세 식별 👀
지표는 감지된 추세 방향에 따라 캔들 색상을 지정하여 시장이 상승세인지 하락세인지 빠르게 식별할 수 있게 합니다. 필터링된 선 사이의 색상 구름은 움직임의 강도와 방향을 시각적으로 강화합니다.
진입 및 청산 시점 ➡️🚪
눈에 띄는 아이콘으로 표시된 매수/매도 신호는 시장에 진입하거나 청산할 잠재적 순간을 나타냅니다. 이 신호들은 가격이 적응형 밴드를 극복할 충분한 모멘텀을 보일 때 추세 시작을 포착하려고 합니다.
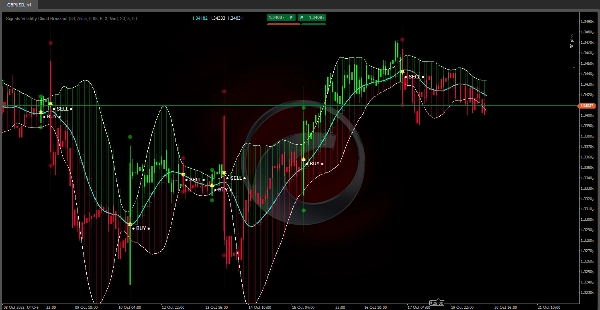
포지션 관리 💼
상단 및 하단 밴드는 다음을 위한 기준 레벨 역할을 합니다:
- 동적 스톱 결정
- 상대적 과매수/과매도 구역 식별 🏷️
- 추세가 약해지는지 평가 (가격이 중앙선 쪽으로 되돌아가는 경우) 📉