
الوصف
مؤشرات متجر Pinescriptlabs: روبوتات cBots متجر Pinescriptlabs : (cBot) اختراق الذهب و BTCنقاط محورية الجلسة(جديد)
هيكل السوق المتقدم: Bos, Choch, SwinLevels, كتل الأوامر، مكتشف هيكل السوق والسيولة (جديد)
خوارزمية ذكية متتبعة (جديد)
تحليل
هيكل السوق الديناميكي
لـ
نقاط
الانعطاف
انحدار خطي فيبوناتشي
متعدد الأطر الزمنية
متعقب
انحياز الشمعة متعدد المستويات
دعم ومقاومة تلقائي
خطوط الاتجاه
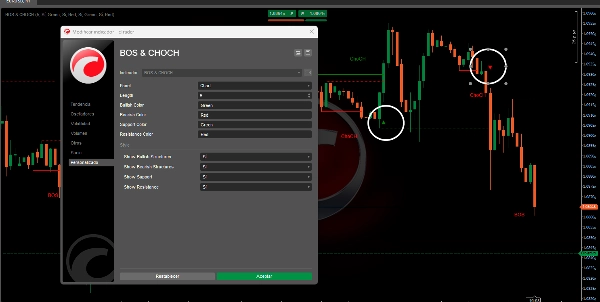
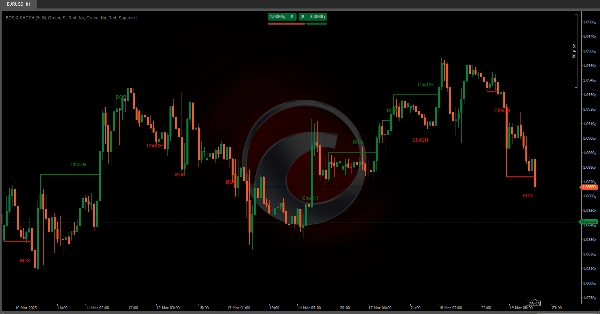
تم تصميم الخوارزمية لتحديد أنماط هيكل السوق ، وبشكل خاص مفاهيم تغيير الشخصية (ChoCH) 🔄 و كسر الهيكل (BoS) 💥. أدناه، سأشرح بالتفصيل ما تفعله هذه الخوارزمية، هدفها، وكيف تحدد هذين المفهومين.
ماذا تفعل الخوارزمية؟
تستخدم الخوارزمية الفراكتلات (القمم والقيعان المحلية) لتحديد ما إذا كان السعر قد غيّر سلوكه أو كسر هيكلًا تم تأسيسه سابقًا. فيما يلي الوظائف الرئيسية:
كشف الفراكتلات 📊
- يحدث فراكتل صعودي عندما يكون هناك قمة محلية حيث الشموع على الجانبين أقل. 📈
- يحدث فراكتل هبوطي عندما يكون هناك قاع محلي حيث الشموع على الجانبين أعلى. 📉
- تعمل هذه الفراكتلات كنقاط مرجعية لتحديد التغيرات في هيكل السوق.
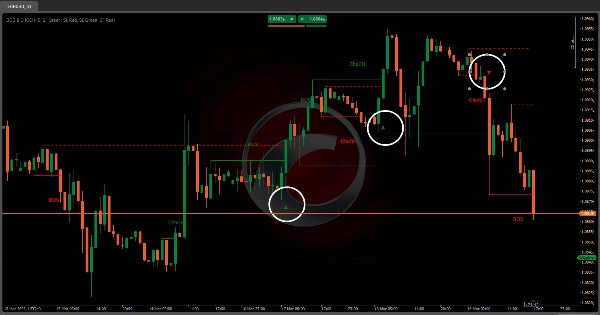
تحديد ChoCH (تغيير الشخصية) 🔄
- يحدث ChoCH صعودي عندما يتجاوز السعر فراكتل صعودي دون تشكيل هيكل هبوطي كامل مسبقًا.
- يحدث ChoCH هبوطي عندما ينخفض السعر تحت فراكتل هبوطي دون تشكيل هيكل صعودي كامل مسبقًا.
- يشير هذا إلى أن السوق قد غيّر شخصيته (من اتجاه إلى تماسك أو العكس).
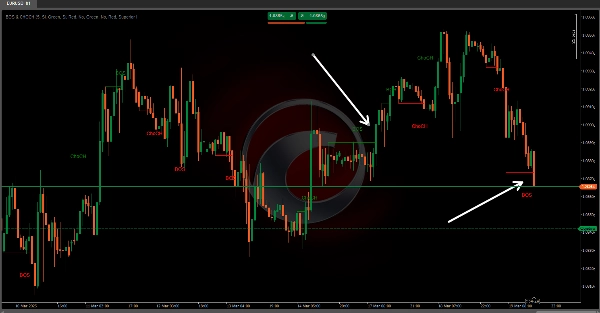
تحديد BoS (كسر الهيكل) 💥
- يحدث BoS صعودي عندما يتجاوز السعر فراكتل صعودي بعد تشكيل هيكل هبوطي كامل مسبقًا.
- يحدث BoS هبوطي عندما ينخفض السعر تحت فراكتل هبوطي بعد تشكيل هيكل صعودي كامل مسبقًا.
- يشير هذا إلى أن السوق قد كسر هيكلًا تم تأسيسه سابقًا، والذي يمكن أن يكون نقطة دخول أو خروج مهمة.
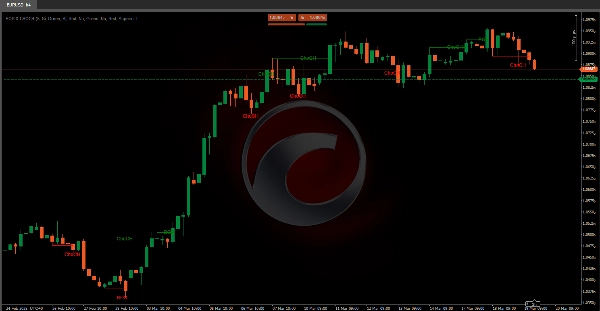
تصوير الدعم والمقاومة 🛡️
- يمكن للخوارزمية رسم خطوط الدعم والمقاومة استنادًا إلى الفراكتلات المكتشفة.
- كما تتحقق مما إذا كانت هذه الخطوط مكسورة، معلمة نقاط الاختراق بأيقونات بصرية.
توفر هذه الخوارزمية للمتداولين رؤى قيمة حول سلوك السوق من خلال تحديد واضح للتغيرات الهيكلية الرئيسية وفرص الاختراق المحتملة. من خلال الاستفادة من إشارات ChoCH 🔄 و BoS 💥، يمكن للمتداولين اتخاذ قرارات أكثر وعيًا بشأن الدخول والخروج وديناميكيات السوق بشكل عام.
الملخص
Key functionalities include:
- **Fractal Detection:** Identifies bullish fractals (local highs with lower candles on both sides) and bearish fractals (local lows with higher candles on both sides).
- **Change of Character (ChoCH):** Signals when the market changes its behavior, such as shifting from trend to consolidation, by surpassing fractals without forming a complete opposite structure.
- **Break of Structure (BoS):** Indicates when the market breaks a previously established structure, marking potential entry or exit points.
- **Support and Resistance Visualization:** Draws support and resistance lines based on fractals and marks breakout points with visual icons.
This indicator aids traders in understanding market dynamics by clearly highlighting structural changes and breakout opportunities, supporting more informed trading decisions.
تقييمات العملاء
5 | 100 % | |
4 | 0 % | |
3 | 0 % | |
2 | 0 % | |
1 | 0 % |


![شعار "Gaussian Channel [Iridio Capital]"](https://cdn.ctrader.com/image/webp/7c039209-5573-4a54-a072-f9528b503103_41960)