
설명
🚀 10,000명 이상의 트레이더들이 이미 우리의 TOP 지표🏆
전문가들이 왜 우리를 선택하는지 알아보세요 – 가장 강력한 도구들이 cTrader(지표, 알고리즘, cBots)에서 여러분을 기다리고 있습니다.
👉 모든 TOP 시스템을 여기에서 받으세요:
_______________________________________________
📌 시장 구조 지표
· ✅ AdvancedMarket Structure: Bos, Choch, SwinLevels, Order Blocks, Market Structure& 유동성 탐색기
· 🔄 동적 시장 구조 전환점 분석
· 🧱 오더 블록
· ⚖️ 시장 불균형
· ⛓️ BOS & CHOCH
· 🧠 ICT 파워 오브 3
· 🌀 시장 극성 구역
_______________________________________________
🔚 스마트 종료 시스템
· 📍 추적 스마트 알고리즘
_______________________________________________
📐 지그재그 지표
· 🔍 지그재그 가격 유동성 투영
· 🧭 S&R 구조적 지그재그
· ➖ 지그재그
· 🎯 지그재그 극단 추적기
_______________________________________________
🧱 지지 및 저항 지표
· 🟩 스마트트렌드 지지 및 저항선
· 🧱 모든 지지 및 저항 레벨
_______________________________________________
📊 추세 및 채널 지표
· 🔄 자동 추세 채널
· 📊 슈퍼트렌드
· ⚡모멘텀 추세 분석기
· 🧠 적응형 추세 채널
· 💥 채널 돌파 시스템
· 🌈 동적 추세 그라데이션
· ⭐ 프리미엄 SSL 채널
· 🔁 반응형 이동평균
_______________________________________________
💧 거래량 및 유동성 도구
· 🔥 거래량 POC 히트맵
· 📉 레버리지 청산 맵
· 🔍 모멘텀 공정 가치 갭
· 🕒 공정 가치 갭 세션
_______________________________________________
⚡ 모멘텀 및 RSI 지표
· 📈 RSI 추세 트리거
· 🚀 동적 범위 모멘텀
_______________________________________________
🔮 예측 및 투영 도구
· 📈 거래량 기반 시장 흐름 투영기
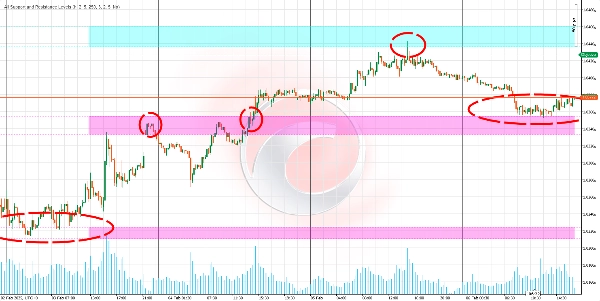
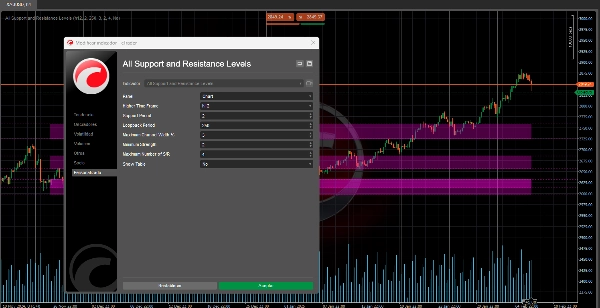
이 알고리즘은 시장의 주요 레벨을 식별하는 데 도움을 주기 위해 설계된 고급 지지 및 저항 지표입니다.
주요 장점은 일간, 주간, 월간과 같은 어떤 타임프레임의 지지 및 저항 레벨도 현재 분석 중인 차트(예: 15분 또는 1시간 차트)에서 직접 볼 수 있다는 점입니다. 📊⏰
무엇을 위한 것인가요? 🎯
주요 시장 구역 식별:
- 가격이 멈추거나 반등하거나 강하게 돌파할 수 있는 레벨을 감지합니다. 🛑↗️↘️
- 진입, 청산, 손절매에 대해 더 현명한 결정을 내리는 데 도움을 줍니다. 💡📈📉
차트를 전환하지 않고 여러 타임프레임 분석:
- 낮은 타임프레임(예: 15분 또는 1시간)에서 거래하면서 높은 타임프레임(일간, 주간)의 중요한 레벨을 볼 수 있습니다. 🕒📅
- 계속해서 차트를 전환하지 않고도 더 넓은 시장 관점을 제공합니다. 🌍🔍
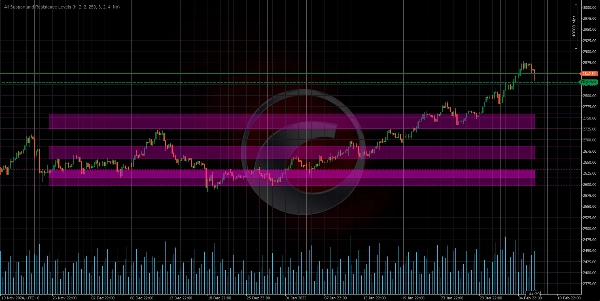
중요한 레벨 우선순위 지정:
- 지표는 과거에 가격이 얼마나 자주 해당 레벨과 상호작용했는지에 따라 지지 및 저항 레벨의 "강도"를 평가합니다. 💪📊
- 이를 통해 가장 관련성 높고 신뢰할 수 있는 레벨에 집중할 수 있습니다. 🎯✅
논리는 어떻게 작동하나요? 🧠⚙️
데이터 수집:
- 지표는 특정 타임프레임(일간, 주간 등)의 고가와 저가를 가져옵니다. 📈📉
- 이 데이터는 가격 행동의 주요 패턴을 찾는 데 사용됩니다. 🔍📊
핵심 지점(피벗) 감지:
- 인근 가격과 비교해 가격이 최고점이나 최저점에 도달한 지역적 고점과 저점을 식별합니다. ⛰️🌄
- 이 지점들은 지지 또는 저항 레벨 후보가 됩니다. 🎯📌
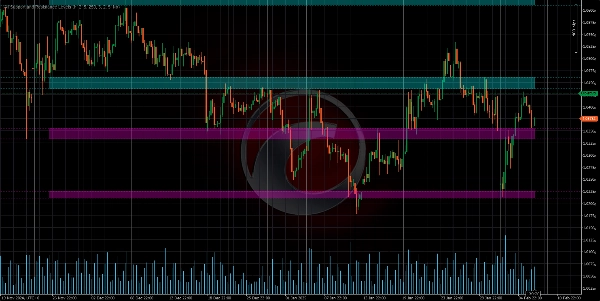
레벨 그룹화:
- 인접한 레벨들은 정확한 선이 아닌 지지 또는 저항 구역을 형성하도록 그룹화됩니다. 🟦🟧
- 이는 지지와 저항이 정확한 점이 아닌 영역이라는 개념을 반영합니다. 📏🎯
레벨 강도 계산:
레벨의 "강도"는 두 가지 요소로 결정됩니다:
- 접촉 빈도: 과거에 가격이 해당 레벨에 닿거나 근접한 횟수. 🔄📊
- 핵심 지점 군집: 해당 레벨 근처에 있는 고점 또는 저점의 수. 🔗📈
강도가 높은 레벨일수록 더 중요하게 간주됩니다. 💪🎯
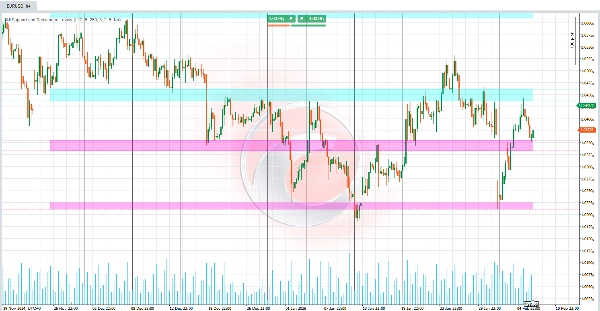
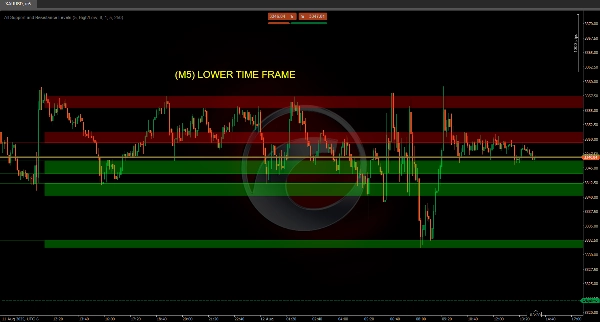
차트 시각화:
- 레벨은 차트에 수평선 또는 색상 구역으로 표시됩니다. 🎨📊
- 각 레벨의 색상은 현재 가격 위치에 따라 다릅니다:
-
- 저항: 가격이 레벨 아래에 있을 때. 🔴
- 지지: 가격이 레벨 위에 있을 때. 🟢
- 범위 내: 가격이 레벨 범위 안에 있을 때. 🟡
차트에서 다른 타임프레임을 어떻게 볼 수 있나요? 🕒📊
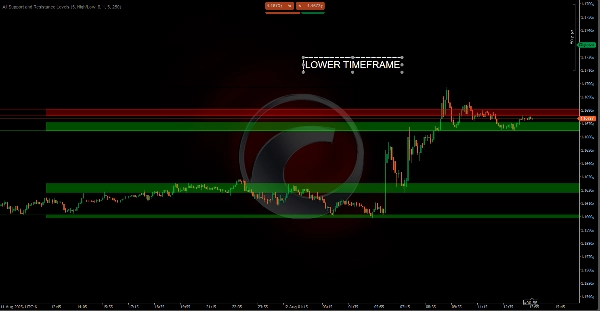
낮은 타임프레임 차트에서 높은 타임프레임의 지지 및 저항 보기:
- 예를 들어, 15분 차트를 분석할 때 지표가 일간 또는 주간 타임프레임의 주요 레벨을 표시할 수 있습니다. 🕒📅
- 현재 차트를 벗어나지 않고도 중요한 상위 컨텍스트 레벨을 볼 수 있습니다. 🌍🔍
높은 타임프레임 차트에서 낮은 타임프레임의 지지 및 저항 보기:
- 덜 일반적이지만, 1분 또는 5분과 같은 작은 타임프레임의 레벨을 일간 또는 주간과 같은 높은 타임프레임 차트에서 볼 수도 있습니다. 🕒📅
- 이는 더 넓은 컨텍스트 내에서 더 상세한 분석에 유용할 수 있습니다. 🔍📊
요약
The indicator analyzes price data by collecting highs and lows from specified timeframes, identifying local pivot points where price peaks or valleys occur. These points are grouped into zones representing support or resistance areas rather than precise lines. Each level is assigned a strength score based on the frequency of price touches and the clustering of key points, helping users prioritize the most significant and reliable levels.
Visualized on the chart as horizontal lines or colored zones, the indicator uses color coding to indicate the price's position relative to each level: red for resistance (price below level), green for support (price above level), and yellow when price is within the level’s range. This tool assists traders in making informed decisions on entries, exits, and stop-loss placements by highlighting where price may stop, bounce, or break with strength.
고객 리뷰
5 | 50 % | |
4 | 0 % | |
3 | 0 % | |
2 | 0 % | |
1 | 50 % |


!["[Hamster-Coder] Pivot Points MTF" 로고](https://cdn.ctrader.com/image/webp/4c143e5a-309c-40e3-a578-f04d1e133ffa_31159)


