
설명
고급 QQE(정성적 정량적 추정) 지표를 소개합니다. 이 강력한 도구는 두 개의 QQE 지표를 결합하여 향상된 거래 통찰력을 제공합니다.
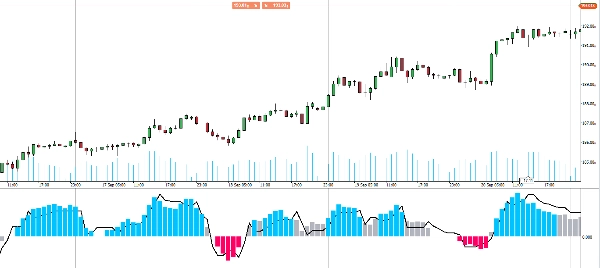
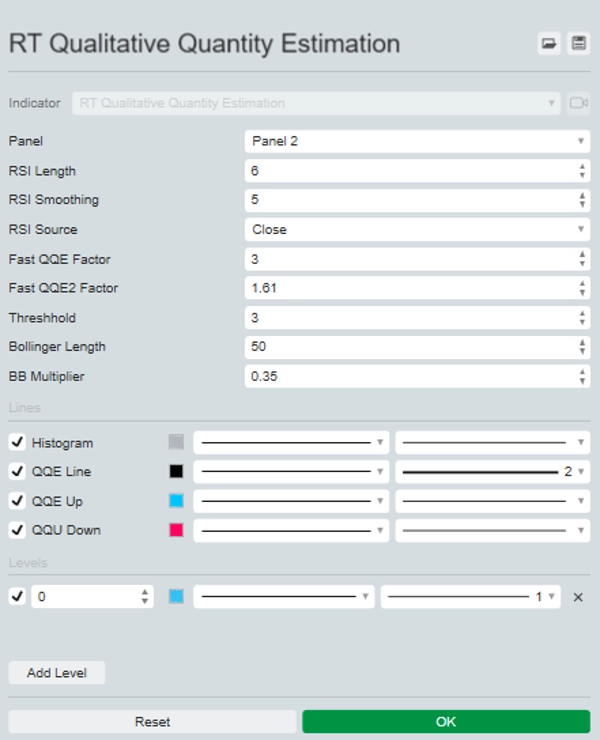
한 QQE는 차트에 열로 표시되며, 다른 하나는 50기간 볼린저 밴드를 제로선으로 사용하는 배경에서 작동합니다.
이 설정은 시장 모멘텀을 시각적으로 평가하고 잠재적 진입점을 명확하게 식별할 수 있게 해줍니다. 두 QQE 지표가 일치할 때는 강한 매수 또는 매도 기회를 알리는 명확한 파란색 또는 빨간색 막대를 볼 수 있습니다.
QQE 지표로 거래 전략을 향상시켜 보다 정보에 기반한 결정과 시장 분석의 정확도를 높이세요.
요약
지표 프로필
고객 리뷰
0.0
리뷰: 0
고객 리뷰
이 상품에 대한 리뷰가 아직 없습니다. 이미 사용해 보셨나요? 다른 사람들에게 가장 먼저 소개해 주세요!
상담
자주 묻는 질문(FAQ)
BTCUSD
Forex
Signal
Indices
EURUSD
Commodities
GBPUSD
NZDUSD
Crypto
Stocks
XAUUSD
NAS100
USDJPY
트레이딩 봇, 지표, 플러그인 등 cTrader Store에서 제공되는 상품은 제3자 개발자에 의해 제공되며, 이는 단순히 정보 및 기술적 접근을 목적으로 제공된 것입니다. cTrader Store는 중개인이 아니며, 투자 조언, 개인별 추천 또는 향후 성과에 대한 어떠한 보장도 제공하지 않습니다.


!["[Hamster-Coder] Bollinger Bands" 로고](https://cdn.ctrader.com/image/webp/21d8e5d6-fb11-4bac-b9ee-cd05c2b76804_30327)


가격
가입일 25/09/2024
20
판매