

Descrição
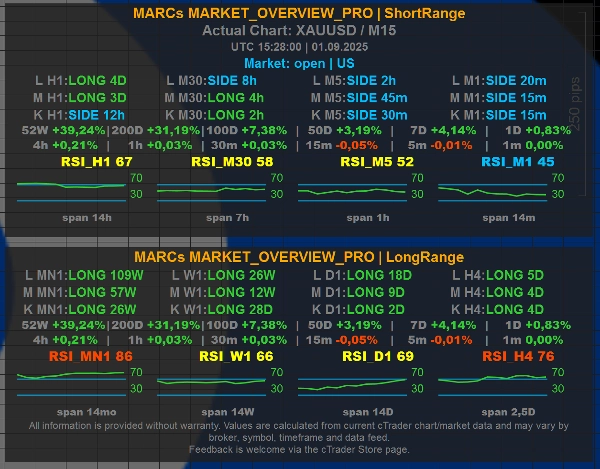
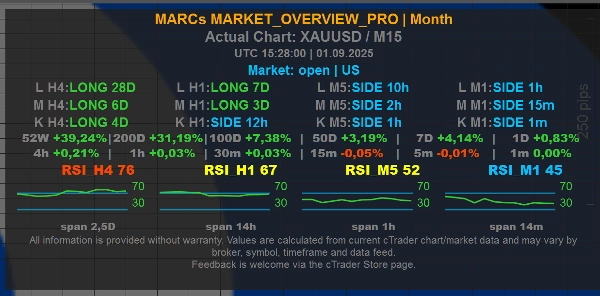
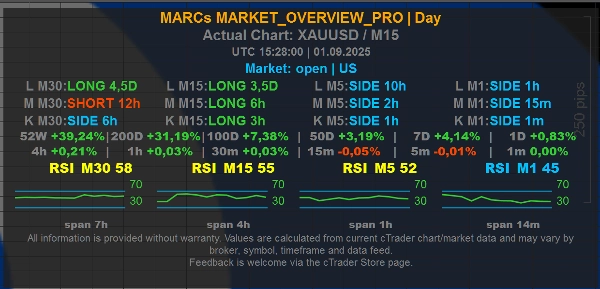
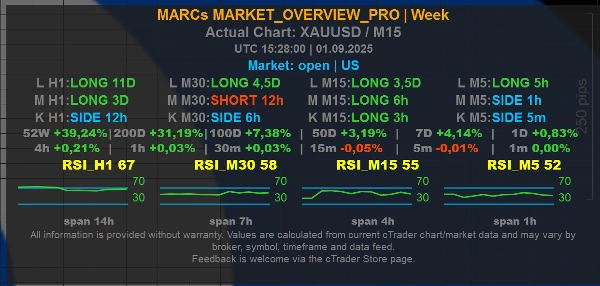
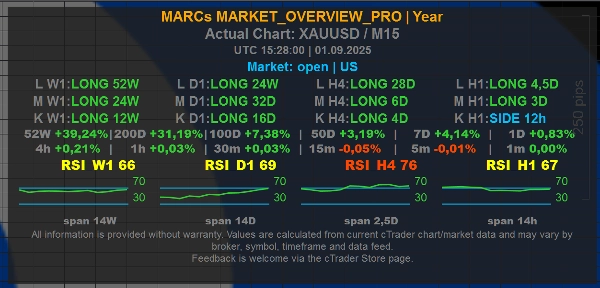
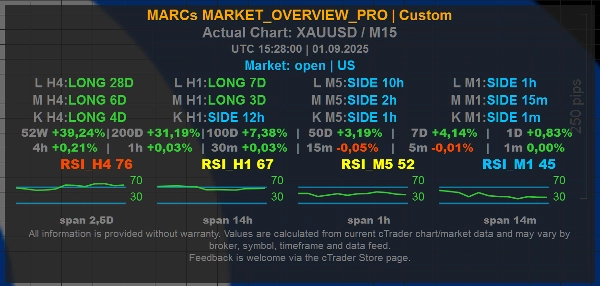
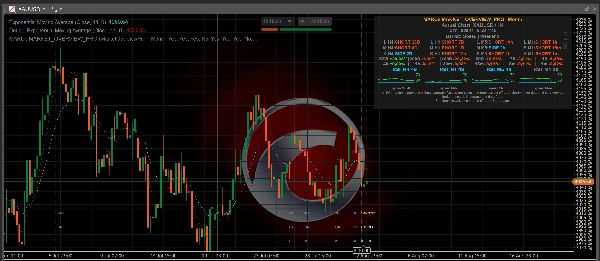
MARCs MARKET_OVERVIEW_Pro é um indicador de visão geral do mercado em múltiplos períodos para cTrader.
Ele exibe um painel compacto no gráfico com contexto de tendência, leituras de RSI, informações do mercado/sessão e predefinições configuráveis de horizonte temporal. O indicador foi originalmente desenvolvido em torno da análise XAUUSD / Ouro, mas foi projetado para funcionar como uma ferramenta geral de visão geral do mercado em qualquer símbolo de gráfico disponível, dependendo da qualidade dos dados do corretor e do histórico de mercado disponível.
Principais características:
- Linhas de tendência em múltiplos períodos para contexto de mercado curto, médio e longo
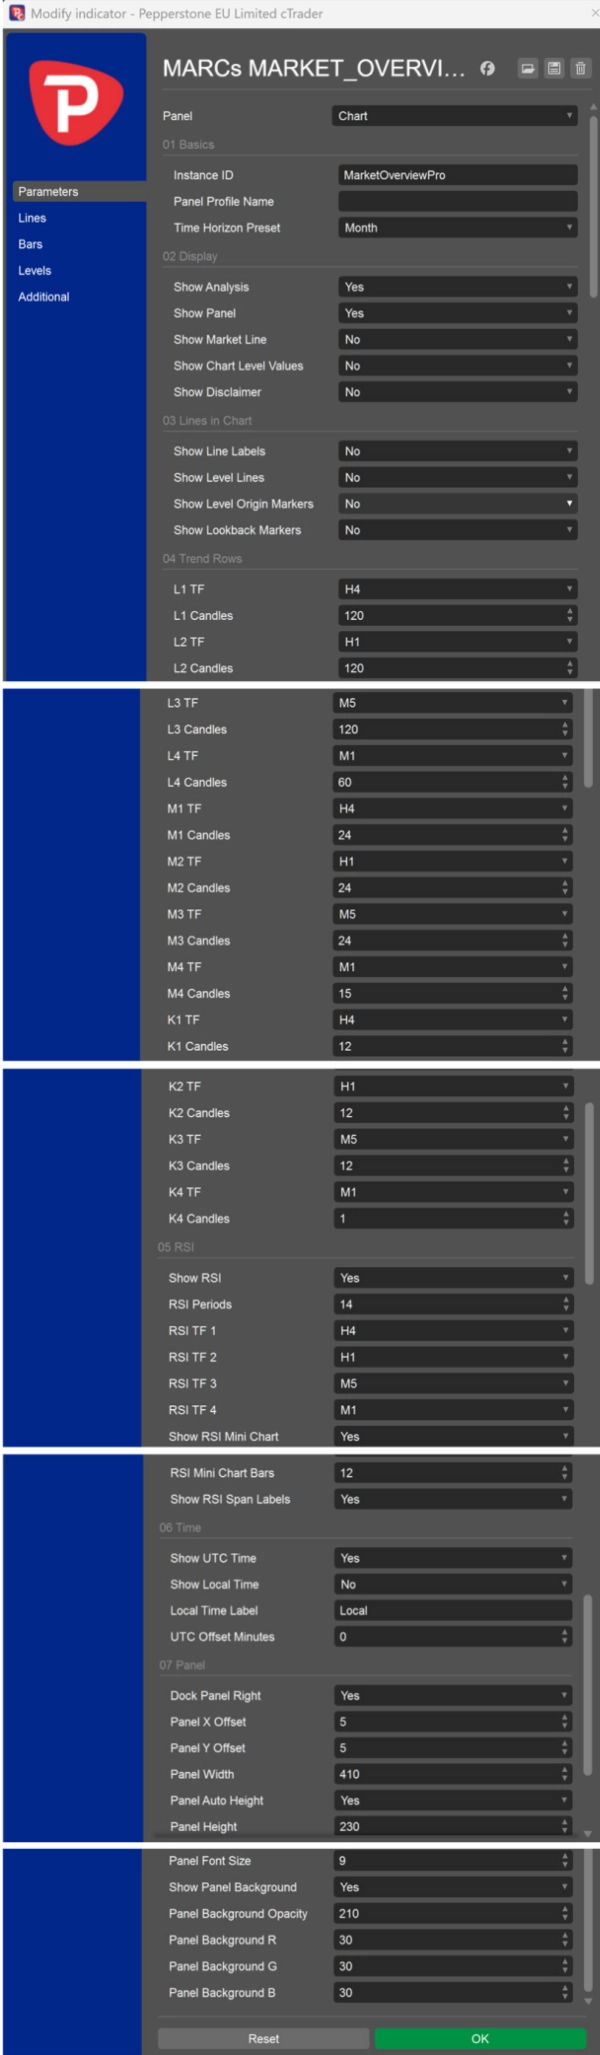
- Predefinições configuráveis para Dia, Semana, Mês, Ano, Curto Alcance, Longo Alcance e Personalizado
- Valores de RSI e mini gráficos de RSI em múltiplos períodos selecionados
- Exibição opcional do horário UTC e local
- Linha opcional de mercado/sessão
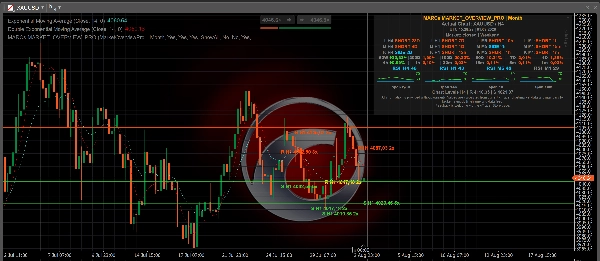
- Linhas de referência opcionais no nível do gráfico
- Valores opcionais no nível do gráfico mostrados diretamente no painel
Linhas de Nível e Valores no Nível do Gráfico:
A configuração opcional Mostrar Linhas de Nível pode exibir níveis de referência calculados do gráfico a partir de um período selecionado: M1, M5, M15, M30, H1, H4, D1, W1 ou MN1. Para essas seleções individuais de período, o indicador mostra a resistência calculada mais próxima acima do preço atual e o suporte calculado mais próximo abaixo do preço atual. MostrarTudo exibe o conjunto mais amplo de níveis H1 a partir do cálculo existente do nível H1. Nenhum mantém as linhas de nível ocultas.
A configuração opcional Mostrar Valores no Nível do Gráfico pode mostrar os mesmos valores de referência de resistência/suporte mais próximos diretamente no painel sem desenhar linhas no gráfico. A linha do painel é rotulada, por exemplo, "Níveis do Gráfico H1 | R ... | S ..." para deixar claro que os valores se referem a referências no nível do gráfico.
Como as Linhas de Nível são calculadas:
Os níveis são derivados de máximas e mínimas passadas no período selecionado. Pontos próximos de oscilação são agrupados em clusters de nível, e apenas áreas com toques repetidos suficientes são mostradas. Isso torna as linhas marcadores visuais de contexto de mercado baseados no histórico disponível do gráfico.
Importante:
MARCs Market Overview Pro é uma ferramenta de visão geral do mercado apenas para análise. Ele não realiza operações, gerencia posições, fornece aconselhamento de investimento ou garante resultados de negociação.
Linhas de Nível não são sinais de compra, sinais de venda, recomendações de stop-loss, recomendações de take-profit ou aconselhamento de investimento. Elas não preveem que o preço irá reverter, romper ou reagir em um nível específico.
Todas as leituras dependem dos dados disponíveis do gráfico cTrader, feed de símbolo do corretor, período e histórico de mercado. Os valores podem diferir entre corretores, símbolos e feeds de dados.
Negociar envolve riscos. Desempenho passado não garante resultados futuros.
NOTA DE TRANSPARÊNCIA
Este indicador foi desenvolvido com a assistência de ferramentas baseadas em IA.
Resumo
The indicator supports optional display of UTC and local times, market/session lines, and chart-level reference lines. These reference lines represent calculated support and resistance levels derived from clusters of past swing highs and lows on selected timeframes ranging from 1 minute to monthly intervals. Users can choose to show these levels as lines on the chart or as numeric values within the dashboard panel.
Originally developed with a focus on XAUUSD (Gold), MARCs MARKET_OVERVIEW_Pro is adaptable to any chart symbol supported by the broker’s data feed and market history. It serves as an analysis tool providing visual market structure and momentum insights but does not execute trades or offer trading advice. The indicator’s readings depend on the quality and availability of broker data and chart history.
Conversa
Avaliações de clientes
Perguntas frequentes
Mais deste autor


















Preço