
Descrição
Localizador de Sinais de Candlestick para cTrader
Transforme os candlesticks japoneses em uma linguagem visual clara.
O Localizador de Sinais de Candlestick é um indicador avançado para cTrader que detecta automaticamente os padrões de candlestick japoneses mais populares e os destaca diretamente no seu gráfico usando etiquetas e cores claras.
Chega de escanear velas uma a uma: o indicador faz o reconhecimento de padrões para você e mostra onde o preço está imprimindo sinais potenciais de reversão ou indecisão.
Padrões detectados
O indicador identifica automaticamente:
- BE – Bullish Engulfing → possível reversão de alta
- SE – Bearish Engulfing → possível reversão de baixa
- H – Hammer → possível repique/reversão de alta após uma queda
- SS – Shooting Star → possível reversão de baixa após uma alta
- D – Doji → indecisão, área para ter cautela
- MS – Morning Star → forte potencial de reversão de alta
- ES – Evening Star → forte potencial de reversão de baixa
- PL – Piercing Line → possível reversão de alta
- DC – Dark Cloud Cover → possível reversão de baixa
- BH – Bullish Harami → possível reversão de alta
- SH – Bearish Harami → possível reversão de baixa
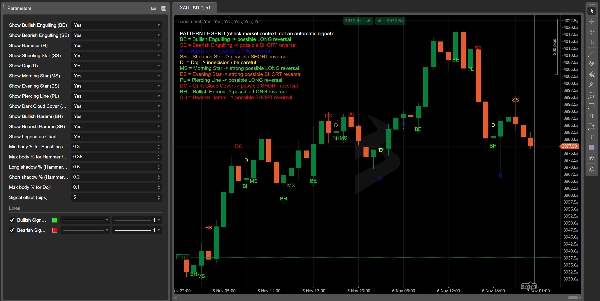
Cada padrão é marcado na vela exata com um código curto (BE, H, SS, etc.) e uma cor que corresponde à legenda.
Legenda colorida no gráfico
No canto superior esquerdo do gráfico, você tem uma legenda colorida que corresponde aos sinais:
- mesmo código
- mesma cor
- explicação curta do que geralmente significa (LONG / SHORT / cautela)
Isso torna o indicador perfeito para:
- traders que estão aprendendo padrões de candlestick
- aqueles que querem um lembrete visual rápido sem abrir um livro ou site
- educadores ou criadores de conteúdo usando gráficos para ensino e análises de trades
Parâmetros totalmente personalizáveis
O Localizador de Sinais de Candlestick oferece controle total sobre a sensibilidade da detecção:
- Percentual mínimo do corpo para candles engulfing e fortes
- Percentual máximo do corpo para hammer, shooting star e harami
- Relação de sombra longa/curta para padrões tipo Hammer / Shooting Star
- Sensibilidade do Doji (quão pequeno o corpo deve ser em relação ao alcance total)
- Deslocamento do sinal em pips para posicionar etiquetas acima ou abaixo das velas
- Interruptores individuais liga/desliga para cada padrão
Você pode ajustá-lo para sinais muito rigorosos (poucos, mas limpos) ou uma detecção mais permissiva para backtesting visual e treinamento.
Por que os traders gostam
- Economiza tempo: não é mais necessário caçar manualmente padrões de candlestick.
- Reduz a subjetividade: as regras são numéricas e repetíveis, não baseadas em suposições visuais.
- Ótimo para educação: perfeito para treinar seu olhar rolando pelo histórico e verificando como os padrões performaram.
- Multi-tempo e multi-ativo: funciona em índices, FX, cripto, ações, commodities – em qualquer lugar onde você possa anexar um indicador no cTrader.
⚠️ Importante: O Localizador de Sinais de Candlestick não é um sistema de trading completo e não substitui uma estratégia completa. Os padrões devem sempre ser usados junto com análise de tendência, contexto de mercado e gerenciamento adequado de risco.
Resumo
The indicator offers customizable detection sensitivity, allowing users to adjust parameters like minimum and maximum body size percentages, shadow ratios, Doji sensitivity, and label positioning. Individual patterns can be enabled or disabled to tailor the indicator to specific needs.
Candlestick Signal Finder supports multiple timeframes and symbols, including indices, forex, cryptocurrencies, stocks, and commodities. It is intended to assist traders in pattern recognition, reduce subjectivity through numeric rules, and serve as an educational tool for learning candlestick analysis. The indicator does not constitute a complete trading system and should be used alongside other analysis methods and risk management practices.
Avaliações de clientes
5 | 100 % | |
4 | 0 % | |
3 | 0 % | |
2 | 0 % | |
1 | 0 % |


