Descrição
Volume Bubbles – Indicador Personalizado cTrader
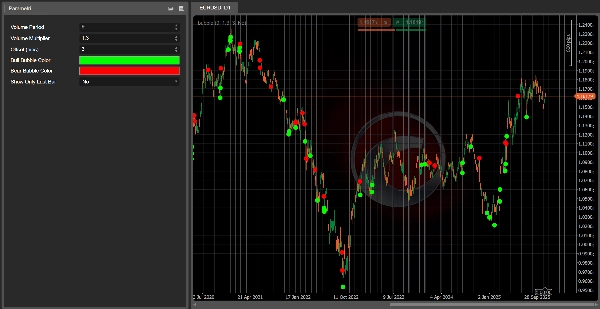
Volume Bubbles é um indicador visual leve, porém poderoso, para cTrader que destaca velas com volume excepcional diretamente no gráfico de preços.
Em vez de ficar olhando o histograma de volume e tentando adivinhar quais barras realmente importam, esta ferramenta detecta automaticamente quando o volume da vela atual está significativamente acima da média recente e desenha uma bolha (ícone de círculo) nessa barra:
- Para velas de alta, uma bolha é desenhada abaixo da mínima da vela.
- Para velas de baixa, uma bolha é desenhada acima da máxima da vela.
Isso torna extremamente fácil identificar possíveis movimentos climáticos, áreas de forte interesse de grandes players ou possíveis pontos de exaustão na tendência.
Principais Características
- ✅ Detecta velas de alto volume usando uma Média Móvel do volume de ticks
- ✅ Desenha bolhas claras no gráfico (não é necessário subjanela extra)
- ✅ Cores diferentes para picos de volume de alta e de baixa
- ✅ Deslocamento ajustável em pips para posicionar as bolhas afastadas da vela
- ✅ Opção para mostrar bolhas apenas na barra mais recente (para negociação em tempo real)
Entradas / Parâmetros
- Período de Volume – Número de barras usadas para a média móvel de volume.
- Multiplicador de Volume – Quantas vezes acima do volume médio uma barra deve estar para disparar uma bolha.
- Deslocamento (pips) – Distância entre a bolha e a máxima/mínima da vela.
- Cor da Bolha de Alta – Cor das bolhas nas velas de alta.
- Cor da Bolha de Baixa – Cor das bolhas nas velas de baixa.
- Mostrar Apenas Última Barra – Se verdadeiro, exibe bolhas apenas na barra atual ao vivo.
Como Usar
Adicione Volume Bubbles ao seu gráfico e use-o como um filtro visual para:
- Confirmar rompimentos respaldados por volume forte
- Identificar possíveis reversões ou velas de exaustão
- Identificar zonas onde grandes players podem estar ativos
Não é um sistema de negociação independente, mas é uma excelente ferramenta complementar para qualquer estratégia de ação de preço ou seguimento de tendência que valorize o volume.
👉 Junte-se aqui: Algotrendit Volume Bubbles
Dentro do servidor você encontrará:
- Suporte para este e outros cBots/indicadores
- Discussão de estratégias e ideias de otimização
- Atualizações, notícias e futuras ferramentas que eu lançar
Resumo
Key features include adjustable parameters such as the volume period for averaging, volume multiplier threshold, bubble offset in pips, and customizable colors for bullish and bearish volume spikes. Users can also choose to display bubbles only on the latest bar for real-time trading. The indicator integrates directly on the price chart without requiring additional subwindows.
Volume Bubbles serves as a visual filter to confirm breakouts supported by strong volume, spot possible reversals or exhaustion candles, and identify zones of significant market activity. It complements price action and trend-following strategies by providing volume-based insights across various markets including forex, indices, commodities, stocks, and cryptocurrencies.
Avaliações de clientes
5 | 0 % | |
4 | 100 % | |
3 | 0 % | |
2 | 0 % | |
1 | 0 % |