
Descrizione
IM_AngleIndicator trasforma la pendenza di una media mobile semplice in una misura angolare oggettiva e comparabile.
La maggior parte degli indicatori "angolo" calcola la pendenza dal cambiamento di prezzo grezzo, ma il risultato dipende dalla scala assoluta dello strumento e dal timeframe — quindi lo stesso valore in gradi significa cose completamente diverse su un cross valutario, un indice o una criptovaluta. IM_AngleIndicator risolve questo normalizzando la variazione della SMA tramite l'ATR: la pendenza è espressa in "ATR per barra" e poi convertita in gradi. In questo modo, una pendenza di 45° rappresenta sempre un movimento di 1 ATR per barra, indipendentemente dallo strumento o dal timeframe analizzato. Il risultato è una lettura coerente e soglie riutilizzabili su tutto il portafoglio.
Come funziona
- Calcola la SMA sui prezzi di chiusura secondo il periodo scelto.
- Misura la sua variazione tra due barre consecutive e la normalizza dividendo per l'ATR.
- Converte il rapporto risultante in gradi tramite arcotangente, restituendo un valore approssimativamente compreso tra −90° e +90°.
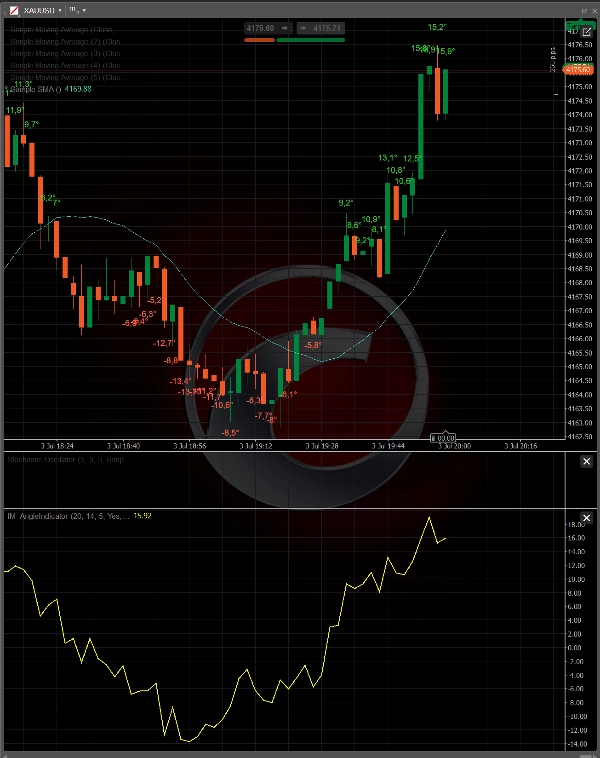
- Traccia il valore come oscillatore in un pannello dedicato e, quando la pendenza supera la soglia impostata, aggiunge un'etichetta sul grafico dei prezzi posizionata sopra il massimo (trend rialzista) o sotto il minimo (trend ribassista).
Caratteristiche principali
- Misurazione della pendenza indipendente da strumento e timeframe grazie alla normalizzazione ATR.
- Soglia configurabile in gradi per filtrare movimenti significativi ed escludere il rumore.
- Etichette codificate per colore direzionale (verde per salita, rosso per discesa) con offset verticale basato su ATR per un posizionamento pulito rispetto alle candele.
- Gestione ottimizzata degli oggetti grafici: le etichette sono limitate alle barre più recenti per preservare le prestazioni anche su grafici con storici lunghi.
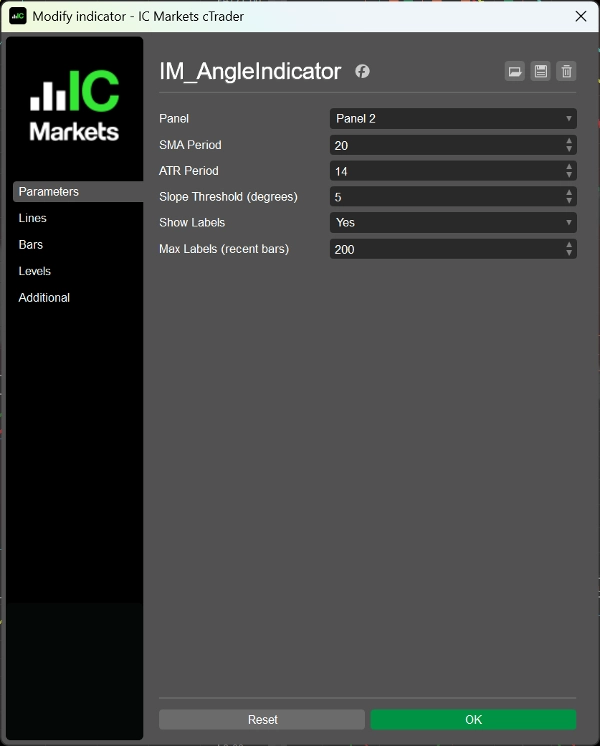
- Parametri completamente personalizzabili: periodo SMA, periodo ATR, soglia di pendenza, visibilità etichette e numero massimo di etichette.
Casi d'uso
- Identificare fasi di trend forte rispetto a fasi laterali.
- Conferma direzionale per supportare strategie di entrata e uscita.
- Confrontare la forza del trend su più strumenti usando la stessa soglia.
- Base per sviluppare cBot che utilizzano la pendenza normalizzata come segnale di trading.
Riepilogo
Recensioni dei clienti
5 | 50 % | |
4 | 50 % | |
3 | 0 % | |
2 | 0 % | |
1 | 0 % |


