
RSI Advanced
Indicatore
1 acquisti
Versione 1.0, Apr 2026
Windows, Mac
5.0
Recensioni: 1

Descrizione
L'indice di forza relativa standard (RSI) è uno degli indicatori più popolari al mondo, ma tracciare una singola linea nella parte inferiore del grafico è un modo obsoleto di fare trading. Rende difficile individuare veri cambiamenti di momentum, accelerazioni e fasi di mercato laterali.
Il RSI Advanced reinventa completamente questo classico oscillatore. Introducendo una Linea Segnale, un Filtro di Volatilità e una Pittura Intelligente del Grafico, trasforma l'RSI in un cruscotto completo, tutto-in-uno per il momentum e il trend-following.
Caratteristiche principali
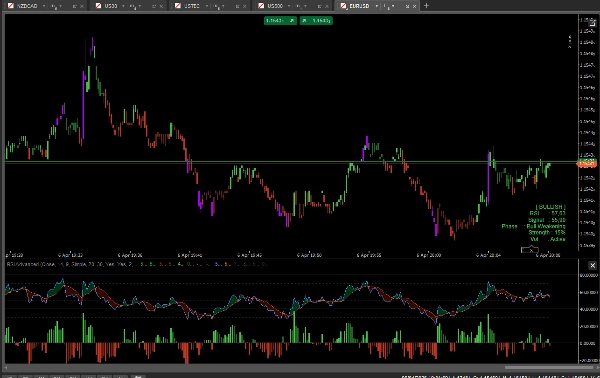
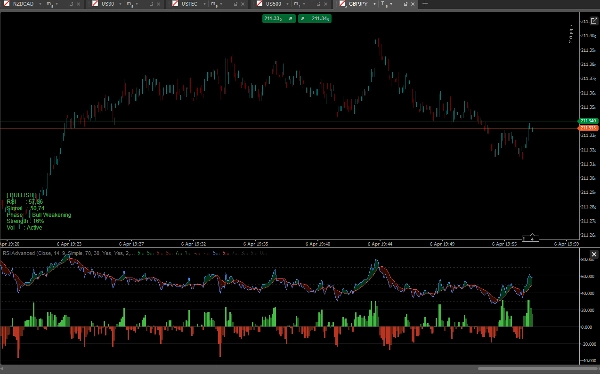
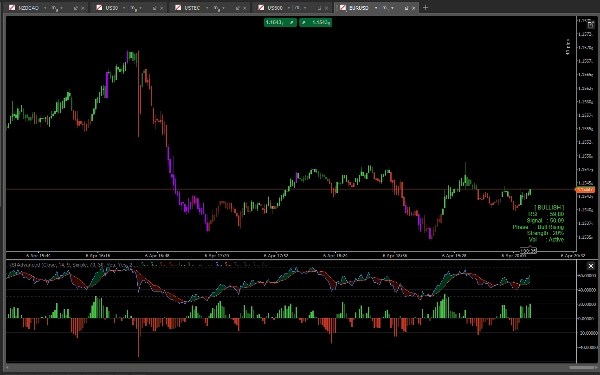
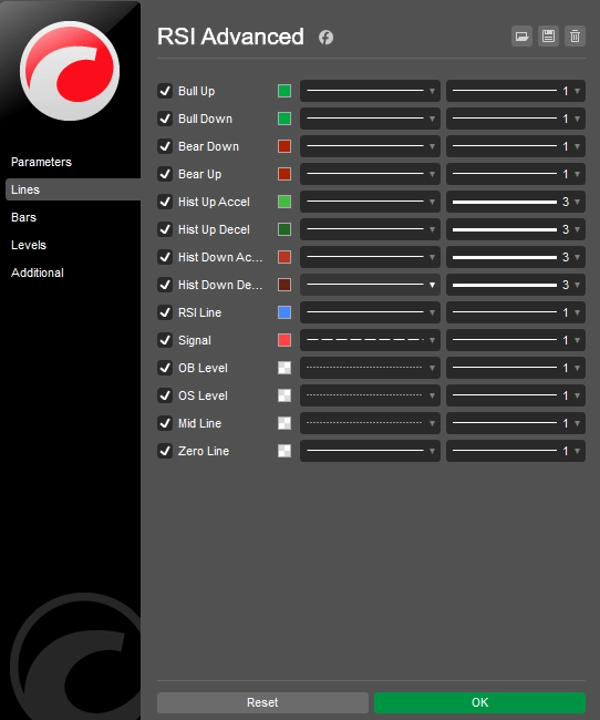
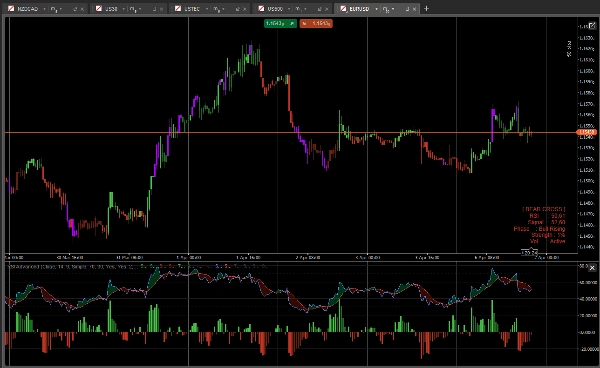
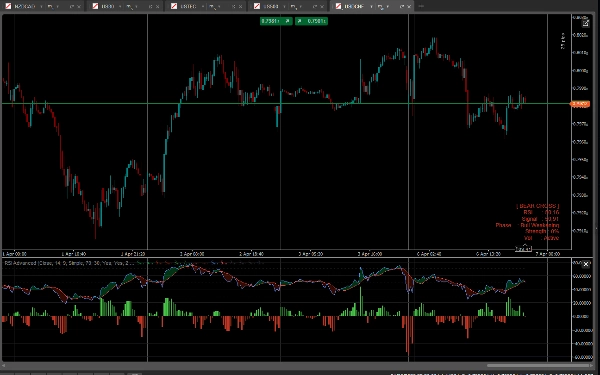
- RSI & Signal Cloud: Abbiamo aggiunto una Media Mobile (Linea Segnale) all'RSI. Lo spazio tra l'RSI e la sua Linea Segnale è riempito con una Nuvola dinamica. Se la nuvola è Verde, i tori guidano il momentum. Se è Rossa, sono gli orsi a controllare.
- Istogramma del Momentum: Un istogramma centrato traccia la distanza esatta tra l'RSI e la Linea Segnale. Con colori incorporati di accelerazione/decelerazione (chiari vs. scuri), puoi anticipare incroci e esaurimenti del momentum prima che accadano.
- Colorazione Intelligente delle Barre (Paintbars): Le tue candele cambieranno colore in base al momentum sottostante dell'RSI:
-
- Verde/Rosso Chiaro: Forte allineamento rialzista/ribassista (RSI > 50 e RSI > Linea Segnale).
- Verde/Rosso Scuro: Momentum debole o ritracciamenti.
- Viola/Magenta: Livelli estremi di ipercomprato (OB) o ipervenduto (OS) – avvertendoti di potenziali inversioni.
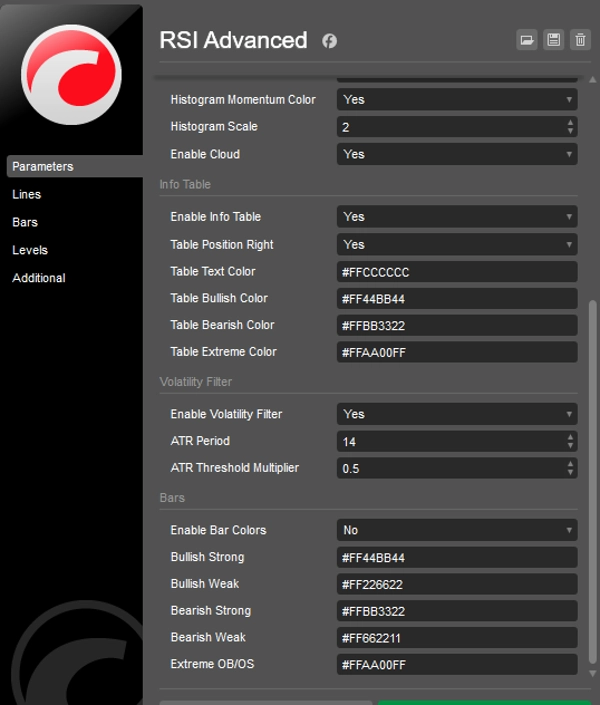
- Filtro di Volatilità Intelligente (ATR): Stanco di essere tagliato a pezzi nei mercati laterali? Attiva il filtro ATR incorporato. Quando la volatilità scende sotto la tua media storica, le candele e l'istogramma diventano grigi, tenendoti fuori da operazioni sfavorevoli.
- Cruscotto Informazioni sul Grafico: Un elegante pannello dati mostra metriche in tempo reale: valori esatti di RSI e Linea Segnale, Fase del Momentum, percentuale di Forza del Trend e Stato della Volatilità.
- Completamente Sbloccato: Fai trading su QUALSIASI simbolo (Forex, Crypto, Indici, Azioni) e QUALSIASI timeframe senza limitazioni. Accesso a vita.
Come fare trading con esso?
- Continuazione del Trend: Cerca ritracciamenti dove l'RSI rimane sopra la linea mediana 50, ma scende leggermente nella Linea Segnale. Quando l'Istogramma accelera (verde chiaro) e le candele diventano verde chiaro, è un forte segnale di entrata per la continuazione.
- Inversioni: Quando le candele diventano Viola (OB/OS estremo), aspetta che l'RSI incroci nuovamente la Linea Segnale (la Nuvola cambia colore) per un setup di inversione ad alta probabilità.
- Evitare il Mercato Laterale: Se il Filtro di Volatilità rende le tue barre grigie, semplicemente resta fermo e aspetta che il mercato si risvegli.
Riepilogo
Profilo indicatore
Categoria indicatore
Volatilità
Tipo di output
Filtro
Requisiti per i dati
Solo barre
Segnali supportati
Superamento
Forza del trend
Volatilità
Recensioni dei clienti
5.0
Recensioni: 1
5 | 100 % | |
4 | 0 % | |
3 | 0 % | |
2 | 0 % | |
1 | 0 % |
Recensioni dei clienti
April 11, 2026
The first thing that worked was timing feels less random, and a small account test feels safer.
Discussioni
Domande frequenti
BTCUSD
Forex
Signal
Indices
EURUSD
Commodities
GBPUSD
NZDUSD
RSI
AI
XAUUSD
NAS100
ATR
USDJPY
I prodotti disponibili tramite cTrader Store, inclusi bot di trading, indicatori e plugin, sono forniti da sviluppatori terzi e resi disponibili esclusivamente a scopo informativo e di accesso tecnico. cTrader Store non è un broker e non fornisce consulenze in materia di investimento, raccomandazioni individualizzate o garanzie di risultati futuri.


Prezzo
24
Vendite
662
Installazioni gratuite