
Descrizione
MACD Advanced — Descrizione dell'indicatore
MACD Advanced è un aggiornamento professionale del classico indicatore MACD per cTrader. Combina la logica standard del MACD con un ricco set di strumenti visivi e livelli analitici, offrendo ai trader una visione molto più profonda del momentum di mercato, della forza del trend e delle condizioni di volatilità — tutto in un unico pannello.
Istogramma con colorazione del momentum
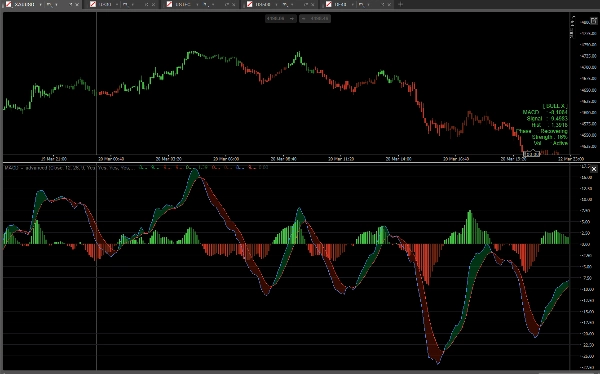
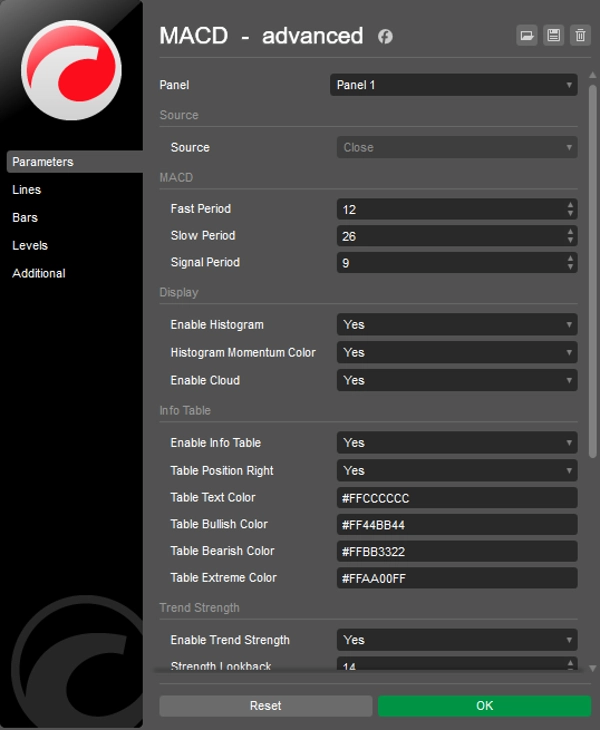
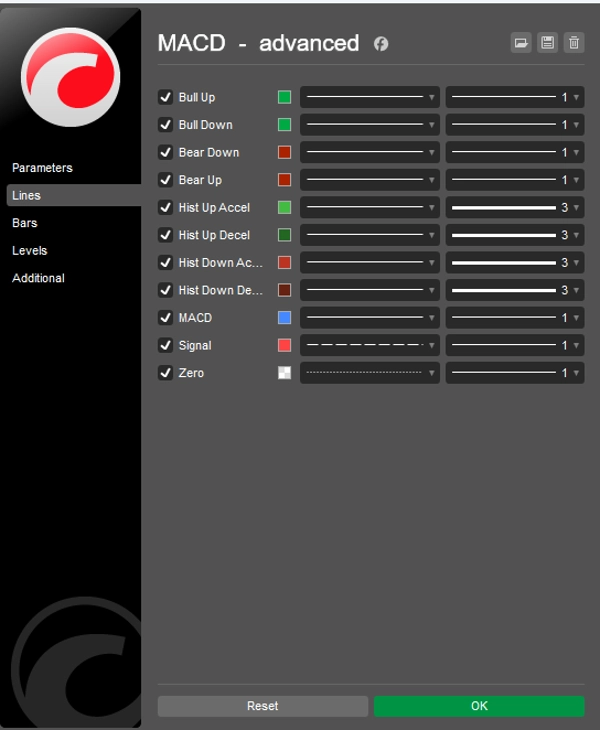
L'istogramma mostra la differenza tra le linee MACD e Signal e utilizza quattro colori distinti per distinguere tra quattro stati di mercato: rialzista in accelerazione, rialzista in decelerazione, ribassista in accelerazione e ribassista in decelerazione. Questo rende immediatamente chiaro se il momentum sta aumentando o diminuendo, senza alcun calcolo manuale.
Nuvola MACD
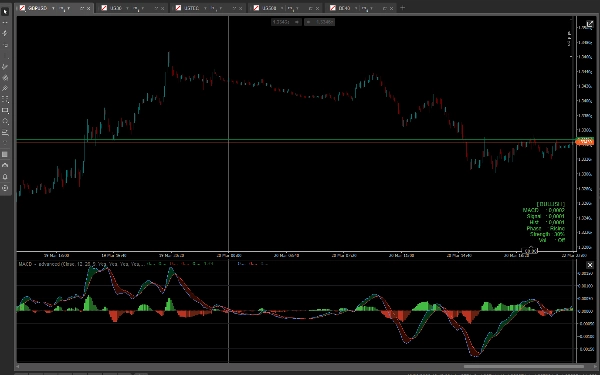
Una nuvola opzionale riempie l'area tra le linee MACD e Signal. Si forma una nuvola verde quando il MACD è sopra il Signal (bias rialzista), e una nuvola rossa quando il MACD è sotto il Signal (bias ribassista). La nuvola fornisce una lettura visiva immediata della direzione del trend a colpo d'occhio.
Forza del trend
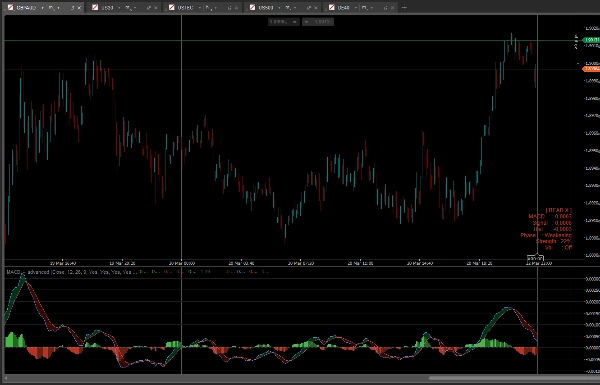
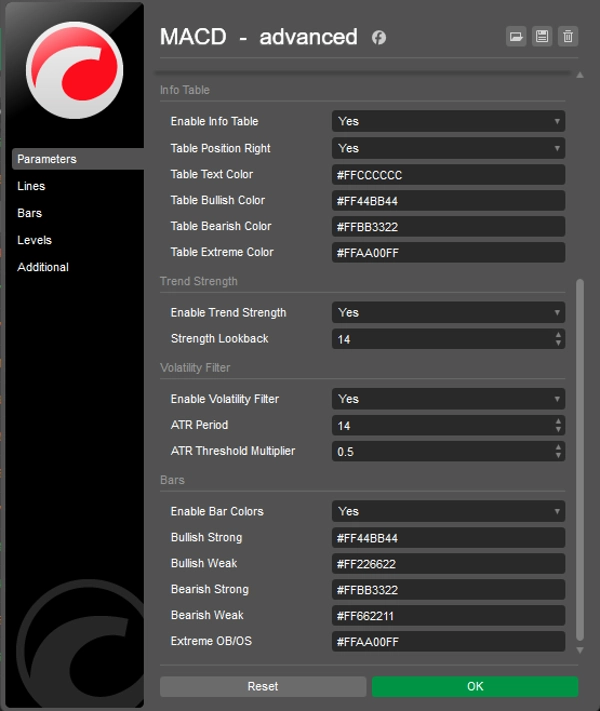
L'indicatore calcola un punteggio di forza del trend in tempo reale basato sulla separazione tra le linee MACD e Signal su un periodo di lookback configurabile. Il risultato viene mostrato come percentuale nella tabella informativa, aiutandoti a valutare quanto sia forte o debole il movimento attuale.
Filtro di volatilità
Un filtro di volatilità opzionale basato su ATR sopprime i segnali durante i periodi di bassa volatilità. Quando abilitato, le barre dell'istogramma e i colori delle barre cambiano in un grigio neutro quando la volatilità scende sotto una soglia configurabile, prevenendo letture errate in mercati tranquilli.
Tabella informativa
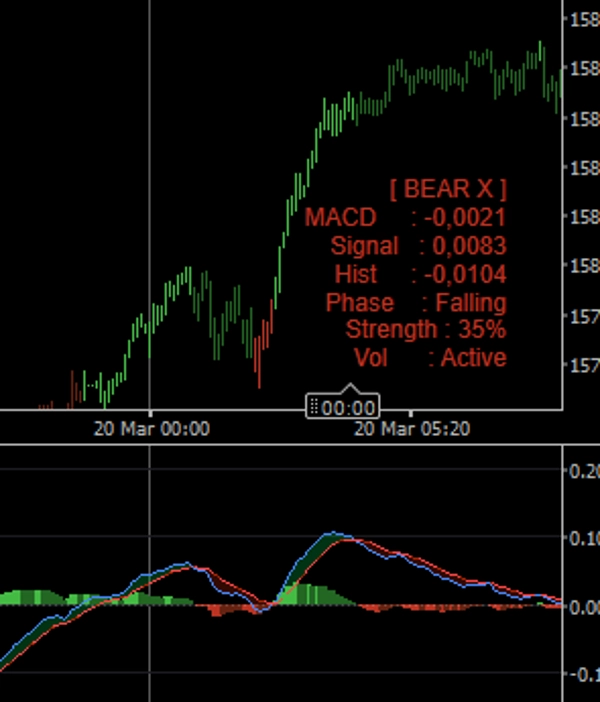
Una tabella compatta sul grafico mostra lo stato attuale del mercato (Rialzista, Ribassista, Incrocio rialzista, Incrocio ribassista, Neutro), i valori esatti di MACD e Signal, il valore dell'istogramma, la fase del ciclo (In crescita, In indebolimento, In recupero, In calo), la percentuale di forza del trend e lo stato del filtro di volatilità. La posizione della tabella (sinistra o destra) e tutti i colori sono completamente configurabili.
Colorazione delle barre
Quando abilitato, l'indicatore ricolora le candele del grafico basandosi sulle condizioni del MACD: forte rialzista, debole rialzista, debole ribassista, forte ribassista e bassa volatilità. Questo porta il segnale MACD direttamente sul grafico dei prezzi senza dover cambiare pannello.
Riepilogo delle caratteristiche principali
- Istogramma del momentum a quattro colori
- Nuvola MACD tra le linee MACD e Signal
- Punteggio di forza del trend in tempo reale in percentuale
- Filtro di volatilità basato su ATR con feedback visivo
- Tabella informativa sul grafico con dettagli completi dello stato del mercato
- Colorazione opzionale delle candele basata sulle condizioni MACD
- Tutti i colori completamente personalizzabili con supporto al canale alfa
- Pulito e leggero — nessun repainting
Riepilogo
Recensioni dei clienti
5 | 33 % | |
4 | 67 % | |
3 | 0 % | |
2 | 0 % | |
1 | 0 % |


